
Agriculture economics

Agricultural economics is the application of economic theory in agriculture so as to obtain maximum profit from production plants and animals.
Production
It’s the creation of goods and services in order to satisfy man’s needs.
Factors of production
This is an aggregate of free gifts of nature, human capacity and all sorts of manmade aides that help in production. The factors of production include land, labor, capital, entrepreneurship.
Land
Land refers to all natural resources used in the production process. It includes soil, minerals, forests, water bodies, air etc. The reward for land is rent. Land can lead to development in several ways:-
- Its where buildings are constructed.
- It provides soil used in agriculture for crop growing.
- It can provide fuel in form of fire wood.
- It is a source of all raw materials used in production such as minerals.
- It can be taxed to provide revenue for the government
- It can be mortgaged for loans.
Characteristics of land
- 1. Its supply is fixed.
- Land is a gift of nature.
- It is geographically immobile that is, it cannot be transferred from one place to another.
- It is occupationally mobile that is, it can be used for various purposes.
- Land is not homogenous for example some land is fertile and another is infertile.
Importance of land in agriculture
- It is used for agricultural activities for example hunting, farming and fishing.
- Land acts as a ground for waste disposal for example sewage disposal
- Land is used for construction of industries, roads, building, etc.
- It is a source of raw materials for example fish, water, minerals, timber etc.
- It is a source of fuel for example coal and oil from the ground, charcoal form forests etc.
- It is a source of government revenue since it can be taxed.
- Land also provides beautiful scenery for tourism which is a source of foreign exchange.
Land tenure
These are rules and conditions governing the ownership of land in a specific area.
Forms of land tenure
- Private ownership / free hold/ land lordship/ individual ownership.
- State ownership
- Communal ownership
- Lease hold
- Co-operative land tenure.
Private land ownership
This is where an individual puts action on a piece of land as his personal property by getting a title deed after registering it with government.
Advantages of private land ownership
- Landowners can mortgage the land for a loan since he has a title deed.
- The owner can use the land the way he likes for developed.
- Land consolidation and planning becomes easy since what is owned by the farmer is known including the value.
- It avoids land disputes since the land is well demarcated.
- It acts as an incentive to farmers to improve the land.
- The landowners can sell the land or part of it easily in case of financial constraints.
- It safeguards against the position of the local community if land is in short supply.
Disadvantages of private land ownership
- Leads to inequalities in wealth and resources within a society.
- Selfish use of land can lead to environmental degradation
- Private landowners might prioritize short-term benefits over long-term sustainability, potentially harming the environment or future generations.
State ownership of land
This is where land belongs to the state and no individual has control over it.
Advantages of land owned by government:
- It allows fast decision making in the use of land by the state.
- It encourages large investments on land by government like plantations, factories etc.
- Government can run out land to raise revenue for development
Disadvantages of land owned by government:
- People have no security over the land occupied since they can be evacuated any time.
- Government can fail to utilize the land efficiently by awarding it to political allies.
- It can be a source of political on-rest when people are sent away from government land.
Communal land ownership
This is where land is owned by the community as opposed to individuals.
Characteristics of communal land ownership
- Its common in the pastoral communities of East Africa
- Land is neither bought nor sold.
- Every member of the community has a right to use land
- Land is allocated to individuals by clan leaders or village elders.
Advantages of communal land ownership
- Every member of the community has access to land irrespective of his social and economic background.
- There is efficient use of land since abandoned land can be given to members of the community.
- Each person can cultivate or graze on the communal land with no restriction.
- There are no cases of landlessness.
Disadvantages of communal land ownership
- It doesn’t give any incentives for improvement of land by the farmer.
- There is a tendency of over stocking and over grazing leading to erosion.
- it’s difficult for a farmer to use the land to get a loan since he has no title deed.
- Increasing population leads to land fragmentation since children have to share their fathers’ land at death.
- Continuous cropping may lead to destruction of soil structure.
- it’s difficult to improve livestock since controlled breeding is hard to practice on such land.
- Pest and disease control is very difficult since farmers are difficult to mobilize under such a system.
Lease hold on land
Here land is given to the tenant by the state or the landlord for a specific period of time usually 49 years and 99 years.
Advantages of lease hold land ownership
- The tenant has security of tenure
- The tenant can use the title secured to acquire a loan for development.
- The tenant can rent out the land to get extra income.
- It minimizes land disputes because of proper land demarcation
- It encourages the growing of perennial crops.
- The tenant is encouraged to carryout land conservation measures.
Disadvantages of lease hold land ownership
They are the same as private ownership.
Co-operative land tenure
This is where land is owned by individuals who organize themselves into a co-operative.
Advantages of Co-operative land ownership
- The land is used efficiently for productive purposes.
- The co-operative organization can use the land as security to acquire a loan
- Group ownership of land is a source of security.
- There is collective work on the land which leads to high production.
- Members can share profits and losses that are made.
Disadvantages of Co-operative land ownership
- Individuals cannot easily get loans for production
- Decision making is difficult as far as usage of land is concerned.
Land reforms in Uganda
This is an organized action designed to improve the structure of land tenure and land use.
Examples of land reform
- Land consolidation
- Land registration
- Land re-distribution
- Settlement and resettlement schemes.
Objectives of land reforms in Uganda
- Achieving high levels of output through security, incentives and investments.
- Achieving flexibility of farming patterns to meet changing natural market demand.
- Increasing productivity of both land and labor.
- Achieving effective utilization of national land resources which can include settlement of people on unused land and introduction of irrigation.
- Encouraging production from the market as opposed to subsistence
- Encouraging conservation and improvement of land.
Settlement and resettlement skills
Reasons for settlement and resettlement schemes
- To ease population pressure by removing people from highly populated places to those with sparse population.
- To prevent pest and disease attack e.g. removing people from places infested with tsetse flies.
- Increase land for agricultural production by removing less productive people from the land.
- To facilitate mechanization of availing more land to the people.
- To settle the landless people who may become a problem within the population.
- To resettle displaced people who might have been displaced by natural calamities and political insures.
- To encourage self-employment to people after being given land.
- To resettle unemployed people so as to reduce rural-urban migration.
- To carryout research in agriculture activities in resettlement schemes.
- Train youth in improved methods of farming so as to improve their welfare.
Land registration
This is where a farmer comes to an agreement with government over the ownership and use of land through the acquisition of land title deed.
Features of a land title deed
- District and county where the land is located
- Block and plot number of the land
- Size of land in hectares
- Registrar of land tittle signature
- Sketch of shape of land
- Occupants Name and address
- The title instrument number
- Date of issuance of the title deed
- Stamp seal mark of the land office
- Chronology of transfer from the first owner to the current occupant
Importance of land registration
- The land owner has security of tenure hence can develop the land.
- He can use the land title to obtain loans.
- Land owner can easily rent out land to get extra income.
- It minimizes land disputes because of proper land demarcation
- It encourages land development through establishment of perennial crops
- Land owner is encouraged to carryout soil conservation measures in order to protect his land.
- It is easy to sale or transfer the ownership of land.
Land Adjudication
This is the process of the final and authoritative determination of the existing right and claims of people to land and subsequent issuance of the legal ownership documents or title deed by the land registrar
Benefits of land Adjudication
- It settles land disputes since it’s the final and authoritative way of determining the existing claims of people to land
- It aids surveying and takes measurements, description and recording of land details used in land registration
- It facilitates registration, transfer of interest and allocation of land in areas where land is not owned by any authority or person
- It helps in compilation and maintenance of a list of rates of compensation payable in respect of crops, buildings of a non-permanent nature and any other thing that may be prescribed.
Land consolidation in Uganda
This is the pooling of small pieces of land to form a large and more productive land when put together.
Steps in land consolidation
- Establish land ownership
- Measurement of the plot to be consolidated in order to establish their size.
- Describing the nature of the fragment
- Valuing the fragments to be consolidated
- Recording each fragment of land for further consideration
- Issuing of the title for the consolidated land or fragments.
Advantages of land consolidation
- Saves time that could have been wasted moving from plot to plot during farm operations.
- Makes supervision of farm operations easy and less costly since they are in one place.
- It encourages mechanization on a farm since the land is big enough which makes the practice economical.
- Agricultural production is increased due to the size of the land.
- It’s easier to provide extension services on the consolidated land.
- Theft of farm produce is reduced due to improved supervision.
- Transport costs of the produce from the garden are reduced since all products are in one place.
- It’s easier to control pests and diseases on the farm.
- It’s easier to carry out soil and water conservation measures.
Disadvantages of land consolidation
- It may make people landless.
- It may cause political unrest among the population
- It’s a very costly exercise since each fragment is of a different value.
Land fragmentation
This is where agricultural farm land is split into small plots of different places belonging to one farmer.
Causes of land fragmentation in Uganda
- An increasing population in the country making land to be scarce.
- Traditional system of land inheritance where sons share the fathers’ land upon his death.
- Limited income among the farmers which forces them to buy small affordable plots.
- Farming systems like shifting cultivation which allows farmers to move from place to place.
Effects of land fragmentation
- It’s difficult to supervise all plots effectively.
- Large scale/commercial farming is not possible
- Farmers fail to secure land title deeds.
- Farmers fail to access social services such as road, water for irrigation etc.
- Farm planning is difficult due to the small size of the fragments.
- It encourages low agriculture production.
- Theft of farm produce is common due to reduced supervision.
- Agricultural mechanization is expensive due to the small size of the plots which are scattered.
- It’s difficult to offer agricultural extension services on such scattered plots.
- It’s difficult to carry out soil conservation measures due to the distance involved.
- Pest and disease control on the fragments is difficult.
- It’s difficult to control grazing since farmers have small plots that are prone to overstocking and overgrazing.
Capital
It’s a stock of assets which are meant for the production of other assets.
Types of capital
- Fixed capital / Real capital: this includes land, building, fences, and machines, tools, livestock and crops in the garden.
- Working capital: this is money or materials used in day to day running of the farm business e.g. fertilizers, fuel, seed etc.
- Private capital: these are assets owned by individuals
- Social capital: these are assets that are owned by the state on behalf of the citizens e.g. roads, schools, hospitals, gov’t farms etc.
Source of capital for agriculture
- Personal savings or undistributed profits of the owners
- Borrowing from relatives and friends
- Borrowing from banks, financial intermediaries, or by selling bonds
- Borrowing from non-bank financial intermediaries like the housing finance companies, insurance companies
- Selling equity shares to investors, such as friends, family, angel investors, venture capitalists, or corporations
- Retained earnings, which are the profits that are reinvested in the business instead of distributed to the owners
- Using debentures by companies in order to raise capital from the public.
- Loans from international financial lending institutions for example I.M.F and World Bank.
- Through gambling and national lotteries.
- Through donations and grants.
- Through the sale of government securities to the public for example treasury bills and bonds in case of public enterprises.
Loans
A loan is a sum of money that is expected to be paid back with interest.
Interest is money paid regularly at a particular rate for the use of money lent, or for delaying the repayment of a debt.
Reasons for high interest on short-term loans
- They yield less interest for lenders.
- They carry a higher risk of loan default.
- The interest repayments are spread out over a shorter period, so lenders charge higher rates to make a profit.
Agricultural credit/loan
It is financial assistance given to farmers either in cash or kind that to be repaid at an agreed interest and time/loan to farmers to aid in agricultural production.
Types of agricultural credits
- Short term credit: usually less than a year used to purchase farm supplies, payment of salaries etc.
- Intermediate /medium credit for a period of 1 to 5 years: usually for purchase of machine, and improvement of farm houses and fence.
- Long term credit beyond 5 years: for purchase of say land.
Importance of agriculture credit
- It allows farmers to finance profitable activities from the farm.
- It encourages the farmer to develop a sense of saving.
- It increases capital development on the farm in form of buildings, fences etc.
- It allows a farmer to finance big investments beyond his incomes.
- It encourages better farming techniques in agriculture
- It can lead to improvement of the standard of living amongst farmers.
Sources of agriculture credit in Uganda
- Commercial banks like Stanbic, DFCU
- Co-operative organizations
- Individual money lenders
- farmers organizations i.e. Uganda National Farmers Organization (UNAFA)
- International bodies like International Fund for Agriculture Development, Food and Agriculture Development, International Monitory fund.
- Development banks like UDB, EDB.
- Marketing board, Uganda Tea Board, Central Bank of Uganda.
Problems encountered by Ugandan farmer in the use and repayment of credit
- High interest rates charged.
- Short grace period which doesn’t allow the farmer to realize the borrowed money.
- Poor loan supervision among the loan providers giving room for defection.
- Crop failure and animal death due to calamities.
- Theft by farm employees
- Price fluctuation of agricultural product.
- High taxes.
- Natural hazards such as floods, pests and disease outbreak.
- Inflation which increases the costs of inputs.
- Fall in demand of the products.
- Unplanned loans.
- Lack of proper enforcement.
- Uncertainties such as sickness and death of a farmer.
- Improper record keeping.
- Poor farm management skills.
- Political interference where a farmer may take the loan advanced to be a political payment or reward.
Steps taken by credit institutions to overcome credit problems
- Educating farmers to promote their knowledge of the use of credit.
- Proper supervision of farmers
- Ensuring flexibility in loan repayment collection
- Reduction of interest rates
- Encourage frequent borrowing for farmers to learn financial literacy
- Send remainders of debt collections
Reasons why agricultural credit scheme has not been very successful in Uganda
- High interest rate
- High financial illiteracy level of farmers.
- Unstable weather
- Insecurity in some area
- Price fluctuation
- Poor market
- Dishonesty among borrowers
- Lack of security/collateral
- Corruption of officials
- Political interference
- Misallocation of funds
Measures that ensure effectiveness of agriculture credit
- Provision of extension services / education to farmers on how to use loans.
- Improvement of loan supervision to ensure prompt payment.
- Improving loan recovery program by encouraging part repayment over a period of time.
- Improving staff training for effective co-ordination with farmers.
- Provide farmers with inputs at fair prices for easy repayment.
- Provide farmers with loans in kinds like fertilizers, pesticides, improved seeds etc.
- Organize marketing of farmers produce at fair prices.
- Give loans to farmers in time or at the correct time to reduce risks.
- Give adequate grace period to allow loan payment to take place easily.
- Charge fair interest rates that can be met by the farmers.
- Help farmers to identify viable projects for investment.
- Lengthen repayment periods.
Advantages of channeling credit through farmers’ organizations/ cooperative
- Credit easily accessed by farmers.
- Guaranteed funds to the farmers.
- The organization can easily follow up the funds.
- Financial training from farmers’ organizations is easily acceptable.
Disadvantages of channeling credit through farmers’ organizations/ cooperative
- Lack of skill
- Political interference
- Corruption
- Farmers’ organization often provide short term and not long term loans.
Reasons why a farmer fails to access credit
- Lack of collateral/security
- Bureaucracy of lending institution
- Illiteracy of farmers
- Corruption from lending institution that may require a bribe first.
- Fear to undertake the risk
- Remoteness of the farm, since most Credit institutions are located in urban areas.
- High interest rates scare away farmers.
- High lending costs scare away farmers
Strategies to improve agricultural lending in Uganda
- Lowering interest rates
- Lowering lending cost and loan processing period
- Improve client – lenders relationships
- Liberalization of financial sector
- Implementing agricultural insurance policies to reduce lending risks.
- Enforce laws to protect borrowers’ from financial institution greed
- Financial training to the farmers.
- Flexible repayment schedule
- Group lending to reduce risks and supervision costs.
Agricultural subsidy
This is an incentive given to the farmers usually in form of reduced prices by the government.
Importance of subsidy scheme in agricultural production
- Stabilize price of agricultural products
- Supplement farmers’ income
- Ensure that the domestic food supply is secure.
- Protect farmers from excessive loss in case of calamities
Labor
This is human effort both manual and intellectual directed towards the process of production.
Classification of labor
- Skilled labor: this is where people perform jobs in which they have training i.e. teacher teaching, doctor treating
- Semiskilled: this is where a person performs a particular job where he has no training but has some knowledge about it or experience.
- Unskilled labor: this is labor provided by people who are not trained at all in such a field.
- Family labor: this is labor provided by family members like children wives, in agriculture work.
Productivity and efficiency of labor
Productivity of labor: refers to output produced per unit of Labor employed in a given time.
Efficiency of labor: refers to the measure of quality and quantity of output a unit of Labor can produce in a given time.
How to improve efficiency and productivity of agricultural labor
Efficiency of labor is the measure of output per person per hour / time
Labor efficiency can be improved by
- on job training
- effective supervision/management
- encouraging specialization
- providing incentives such as attractive salary
- improving technology
- timely payment of wages
- provision of job security
- division labor among employees
- favorable climate/temperature
- maintaining good health of workers
Labor force
This refers to economically active people between 15-65yrs of age excluding students, house wives and disabled.
Labor supply
This is the number of hours worked / period of time.
Factors affecting labor supply in agriculture
- Health conditions of the workers: healthy workers are able to work long hours compared to sickly worker
- Motivation in terms of salaries and allowances.
- Good working conditions such as housing, transport and health allowances attract many laborers.
- Population size: a high population leads to provision of labor e.g. china
- Retirement age: high retirement age guarantees a high labor supply.
- Immigration and emigration (increases or decrease labor)
- Labor mobility: high labor mobility leads to high labor.
- Working time: as number of working time increases supply of labor also increases.
- Strength of trade unions: these can reduce the number of people employed by fixing a minimum wage.
- Nature of work: heavy and risky work attracts fewer laborers.
- Level of education and skills: highly skilled jobs have fewer workers
- Political stability: a stable country has more people willing to work than unstable country.
- Government policies such as minimum age of a laborer and minimum wage may reduce the number people employed
- Attitude toward agriculture
- Level of advertisement of agricultural work
- Rural-urban migration reduce supply of labor on the farms
Labor mobility
This is the ease with which labor can move from one place to another (geographical mobility) or from one job to another (occupation mobility)
Factors affecting labor mobility in agriculture
- Limitations in skills e.g. it’s hard for a sweeper to do doctor’s work.
- Time required for training: along training period reduces the rate at which such people can join that occupation.
- Racial differences: in some countries certain jobs are reserved for a particular race.
- Trade unions: workers can use collective effort to bargain for higher wages and reduce entry of others in employment.
- Transport: poor transport hinder movement of people from place to place.
- Security: poor security can affect the acquisition of jobs in particular areas.
Wages
A wage is a monetary reward to Labor for the services it renders in the production process in a given time.
- Nominal (Money) Wage. This refers to the wage paid to the worker in monetary terms in a given time for example 50000/= paid to the worker per week.
- Real Wage. This refers to the basket of goods and services that a nominal wage can purchase in a given time.

- Reserve wage. This refers to the minimum wage below which the individual cannot accept a given job offer.
Methods of wage determination in Uganda
- Collective bargaining. This refers to round table negotiations between the representatives of the trade union and the aimed at improving wages and other working conditions of the workers. The stronger the higher the wage and the weaker the trade union, the lower the wage
- Government wage determination. This is where the government sets the wage which is to be paid to the employees by the employers. This can either be a minimum wage or maximum wage.
(a) Minimum wage legislation (wage floor). This is where the government sets a wage above the equilibrium wage below which the employer is not allowed to pay the workers. This is done to protect the workers from being exploited by the employers.
(b) Maximum wage legislation (Wage ceiling). This is where the government sets a wage below the equilibrium wage above which the employer is not allowed to pay the workers. This is done to protect the employers from being exploited by the workers, especially through their trade unions.
- Piece rate. This is where wages are paid according to the amount of work done by the employee for example 10,000/= for 2000 bricks made. This is common with unskilled Labor.
- Time rate. This is where wages are paid to employees according to the number of hours worked for example 1000/= per hour, 1O, 000/= per day or 500,000/- per month. This is common with skilled Labor.
- Signing contracts between employers and employees. In this case, contracts are signed which specify the wage to be paid to the employee for a given time.
- Wage leadership. This is where small firms set their wages following the wages paid by large firms to their workers. Therefore large firms determine the wage which is to be paid to the workers by small firms.
- Market forces of demand and supply of Labor. This is where the wage paid to the employees is determined by the market forces of demand and supply in the Labor market.
- Individual bargaining. This is where individual workers bargain with employers the wage they are supposed to be given in a given time.
Note
(a) Wage freeze. This is where the government directly and deliberately keeps down the wages paid to the workers for some time to check on the aggregate demand and control inflation in the economy.
(b) Wage restraint. This is where the government indirectly influences private employers and trade unions to keep down the wages paid to the workers to check on aggregate demand and control inflation in the economy.
Methods of wage payment
(a) Sliding scale method (Wage index system). This is where wage payment is related to the cost of living. Workers are paid more if the cost of living is high and are paid less if it is low.
(b) Bonus system (Wage drift). This is where workers are paid extra pay for the work done in addition to their normal pay rate for the minimum work they are supposed to do.
(c) Payment in kind. This is where a worker is paid in terms of goods for the work done for example giving bunches of bananas to those working in a banana plantation.
(d) Time rate system. This is where a fixed wage is paid to a worker after working for a given time for example a month, a week etc. OR .This is where a worker is paid a fixed wage according to the number of hours the worker allocates to the job.
Causes of wage differences among agricultural workers
- Differences in the levels of education. The higher the level of education, the higher the wage paid to the worker and the lower the level of education, the lower the wage. This is true especially in public service where workers are paid basing on the salary scale.
- Differences in skills and experience. Highly skilled and experienced workers receive higher wages than their counterparts doing the same job for example a senior teacher or engineer earns more than a newly qualified teacher or engineer.
- Differences in the bargaining power between employers and employee’s (Trade unions) trade unions. Workers in trade unions with strong bargaining power are paid more than those in trade unions with weak bargaining power.
- Differences in the cost of living. In areas where the cost of living is high, the workers are likely to be paid higher wages than where the cost of living is low. For example urban worker are paid higher salaries compared to those in rural areas.
- Differences in the nature of the job (that is temporary or permanent). Workers employed for temporary jobs or contracts are paid higher wages than those employed in permanent jobs.
- Differences in working conditions. Worker in risky jobs such as mining are paid higher wages as compared to those employed safe jobs.
- Differences in job status and responsibilities. Workers in high positions with more responsibilities are paid higher wages than those in lower positions with fewer responsibilities e.g. a manager is paid more than the cleaner working in the same organization.
- Differences in elasticity of supply of Labor. Labor that has inelastic supply is paid a higher wage as compared to Labor with elastic supply. For example skilled Labor is paid higher wages than unskilled Labor.
- Differences in demand for products. Labor involved in the production of the product with high demand is paid a higher wage as compared to Labor involved in the production the product with low demand.
- Differences in the health conditions. A worker who is strong and healthy has the ability to do more work hence earning more money than a weak and sickly worker especially under piece rate system.
- Government policy. The government can deliberately fix higher wages for employees in certain sectors and low wages for employees in other sectors. This creates wage differences among workers.
- Differences in mobility of Labor. Labor which is highly mobile is likely to earn more than Labor which is immobile.
- 13. Differences in sex .Generally, male workers earn more wages than their female counterparts.
- Differences in talents. Workers with special talents earn more wages than workers who are not talented. For example musicians, footballers etc. are paid more for their talents.
- Nepotism. Some workers are favored with higher wages compared to their counterparts
Management / entrepreneurship
An entrepreneur is a person who undertakes the task and risk of organizing other factors of production so as to earn profits. The reward for the entrepreneur is profit or loss depending on performance of the business.
Roles of an entrepreneur in a farm production
- provide required capital on the farm
- he bears all risks and losses
- Planning for the farm i.e. making decisions for running of a farm
- Manages the farm
- Purchase of inputs and machinery
- Marketing of produce
- Keeps farm records
- Identifies viable business opportunities
Methods of increasing profits in Agriculture
- Choosing correct business with less risks and uncertainties.
- Selling produce when prices are high i.e. having good storage facilities
- Timely planting of crops so as to benefit from the high prices that are offered at the beginning of the harvesting season.
- Use of better techniques of production i.e. improved seeds, good breeds.
- Processing agriculture products so as to add value hence more profits.
- Advertising your produce so that buyers are aware
- Grading the produce to allow fair prices for each product.
- Parking of the produce so as to reduce transport costs and increase the profit margin.
- Proper control of pests and diseases i.e. increase quality.
- Proper allocation of resources to avoid over spending and under spending.
Costs of production
- Fixed costs / overhead costs / unavoidable costs.
These are expenses that a farmer has to meet whether in production or not. They include interest on loans, rent, depreciation, salaries for permanent workers.
- Variable costs / prime costs.
These are expenses that depend on the level of output or vary with output e.g. costs for inputs (pesticides, seeds) wages for casual workers increase in output increases the variable costs.
- Implicit cost.
These are expenses that are indirect or costs of owned resources e.g. own labor, family labor etc. They are valued using their opportunity cost. NB. They are not included in the calculations of profits of the farm of accounting.
- Explicit costs
These are direct costs paid for resources / bought or hired.
- opportunity cost
This is a cost for the best alternative foregone in making a decision e.g. if a farmer foregoes poultry farming and takes on dairy then the opportunity cost is that one for poultry.
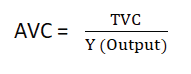
- Total valuable cost (TVC)
This is the total of the cost of all valuable resources used in production (price x quantity)
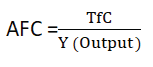
- Total fixed cost
This is the value of all the indirect cost of fixed resources used in production. Its constant at all levels of output.
- Total costs
It’s the sum of all the fixed and variable costs at each level of output i.e. total cost will = total variable cost + total fixed cost.
- Average variable cost
It’s the amount spent on variable inputs per unit of output, i.e.
- Average fixed cost.
It’s the cost of the fixed resources per unit of output.
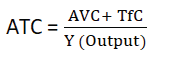
- Average total cost
It’s the total cost of all resources (Fixed and variable) per unit of output.
- Marginal cost
This is the change in total cost resulting from a change in one unit of output i.e. it’s the cost of producing an additional unit of output.
- Marginal product.
This is output created by using one additional unit of a factor of production.
Cost output relationships/Production function
This is a mathematical relationship between input and output
- Total product, TP
This refers to the total output resulting from all the factors of production (both fixed and variable)
- Average product AP
This is the output per unit of variable factors.
An example of relationship between output and inputs
| Fixed factors (land) | Quantity of fertilizers used (input)x | Total maize TP output (Kg) Y | Marginal product (MP) | Average product (AP) |
| 1 | 1 | 8 | 0 | 8 |
| 2 | 18 | 10 | 9 | |
| 3 | 30 | 12 | 10 | |
| 1 | 4 | 38 | 8 | 9.5 |
| 1 | 5 | 44 | 6 | 8.8 |
| 1 | 6 | 48 | 4 | 8 |
| 1 | 7 | 48 | 0 | 6.9 |
| 1 | 8 | 46 | -2 | 5.7 |
| 1 | 9 | 42 | -4 | 5.5 |
Graphical illustration of the relationship between Average product, Marginal product and Total product
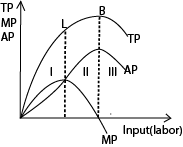
From the graph the following is observed.
- T.P begins by increasing, reaches maximum point B and then falls
- Marginal product begins by increasing reaches a maximum and then decreases up to the negatives.
- Average product begins by increasing, reaches a maximum and then falls.
- When total product (TP) is increasing at an increasing rate (up to point L), Marginal product (M.P) is also increasing. When TP is at maximum M.P is zero, when T.P is falling M.P is negative. Therefore M.P is the measure of the rate of change of total product.
- When average product (A.P) is increasing; M.P is higher than AP and when average product (A.P) is falling M.P is lower than A.P and when A.P is at maximum when MP = A.P.
- L is called a point of inflexion. It refers to the point below which MP is increasing and beyond which M.P is declining. OR. It is a point below which total product is increasing at an increasing rate and beyond which total product is increasing at a declining rate.
From the graph the short run input-output relationship can be explained in three stages of production: –
Stage I: The stage of increasing returns.
This stage starts from output up to the point where AP is at maximum. In this stage TP, MP and AP are generally increasing. TP is increasing at an increasing rate. The ratio of the fixed factor to the variable factor is high. That is, the fixed factor is still underutilized by the variable factor. MP is greater than AP. Any farm) cannot operate in this stage because an increase in the Labor inputs (variable factor) can still lead to increase in output.
Stage II: The stage of diminishing returns.
This is also referred to as the optimal or economic region of production. In this region, MP and AP are declining but MP is still positive. There is efficient utilization of the fixed factor by the variable factor and therefore production should take place in this region. In other words, a rational producer whose aim is to maximize profits should operate in this region. MP is less than AP
Stage III: The Stage of negative returns.
It is also called the intensive stage. In this stage, TP, AP and MP are declining and MP is negative. This implies, employment of an extra unit of a variable factor would instead lead to a decline in the total output. This is due to over utilization of the fixed factor by the variable factor. It is irrational to operate in this stage since the employment of an extra unit of variable factor leads to less output generated.
The law of diminishing returns (The law of variable factor proportions)
The law states that as more and more units of a variable are added to fixed factor (land), product first reach the maximum beyond which it diminishes.
Illustration
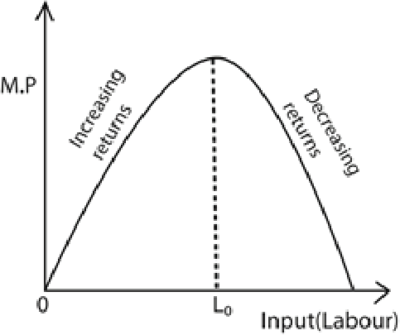
From the graph marginal product increases up to the maximum point beyond which it begins to diminish
The law of diminishing returns necessitates the producers to determine the optimum level of a variable factor which can be combined with fixed factor to yield maximum output.
Economies and diseconomies of scale
Economies of scale (E.O.S) are cost advantages gained by farm/companies when production becomes efficient. Companies can achieve economies of scale by increasing production and lowering costs.
Diseconomies of scale
These are disadvantages accruing to the firm of in form of increased average costs resulting from over expansion of the scale of production of the firm or industry.
Risks and uncertainties
A risk is an avoidable and unforeseeable circumstance hazard that affects the outcome of an investment and can be measured in an empirical and quantitative manner. Since the risks are measurable, they can be insured against.
Examples of risks
- Change in weather or bad weather which causes destruction to crop, building and animals.
- Pest and diseases. This can cause losses in both plants and animals.
- Fire outbreak. This can destroy property and life. This can be of farm produce and machinery yet it’s hard to predict when it will happen.
- Strikes of workers. Some of the strikes are very destructive and lead to loss of property and life at the extreme cases.
- Ill health. The farmer, members of his family, all the workers can fall sick which can greatly affect the production level of the farm.
- Low crop yields. This may be caused by many factors like poor soils, natural hazards, pests and diseases, poor management etc.
- Death of the farmer.
Guarding against risks
- Insurance. This is the most common method of guarding against risks where the farmer insures his property with an insurance company against risks.
- Building owners equity. This is where a farmer saves some money that can be used in case there is a risk (net worth)
- Input rationing. Here a farmer uses less than optimum quantities of inputs to save on the amount spent on input.
- Improving storage facilities i.e. one can lead produce and sale later
- Choosing and enterprise with less or limited risks hence helping a farmer easily escape risks.
- Diversification. This is where a farmer engages in more than one enterprise so that incase one fails the other may succeed and compensate the loss made.
- Production flexibility. This is where a farmer invests inflexible enterprises that easily allow a change e.g. keeping duo purpose breeds of cattle and poultry.
Uncertainties
Uncertainty, this is unforeseeable and unavoidable circumstances or hazard that affects the outcome of an investment but cannot be measured in an empirical and quantitative manner hence cannot be insured against.
Examples of uncertainties
- Price fluctuations: It’s very difficult to know when the prices will fluctuate and the loss which will come out of this is extremely difficult to calculate.
- Change in demand: The demand for agricultural products keep on changing yet the loss as a result of this is difficult to measure.
- Change in technology. Because of rapid technological changes, machinery and farm techniques quickly become outdated.
- Change in government policies. The government may reduce prices of commodities by covering taxes and vice versa.
- Bleach of contract: This can happen anytime without notice and may cause immeasurable loss depending on the commodities.
- Unavailability of labor. This may happen during planting and harvesting time yet the losses caused are immeasurable. This change in labor supply is due to a number of factors affecting it.
- Unavailability of agriculture inputs. The supply of such inputs is affected by a number of factors therefore their scarcity once experienced can cause uncertainty.
How to control of uncertainties in agriculture
- producing on contract
- building owners equity
- diversification
- Input rationing i.e. price fluctuation.
- flexibility i.e. easily change from type of production to another
- Improving storage facilities.
- Adding value of agriculture products through processing.
Specialization
This is where one engages in the production of one item where he can feature best.
Forms of specialization
- Specialization by craft. This is where families specialize in different activities like farming, iron smith, witch craft etc.
- Specialization by process. This is where every stage of production in a factory or an industry is carried out by a different person.
- Regional specialization. This is where each region produces the best it can and the changes it with what it can’t produce.
- International specialization. This is where each country produces what it can do best and exchanges it with what is produced by other countries.
Advantages of specialization
- It’s time saving. There is no wastage of time in moving from job to job or training for different jobs.
- High efficiency in production since the workers gains a lot of experience and skills in doing one type of work over time.
- It enables the farmers to exploit their natural talents by concentrating on the work they can do best.
- It helps to improve on the quality of the product. Workers become perfect in carrying out particular tasks.
- It helps to speed up the training process. This is because a worker is trained to carry out a particular task in the production process.
- It enables workers to exploit their natural talents by concentrating on particulartasks which they can do better:
- It encourages the use of machines at various production levels.
- Regional and international specialization enables countries to exploit their natural resources and get what they cannot produce.
- It increases production which helps farmers to gain from the economy scale.
- Specialization increases economic interdependence between countries. This is because different countries can be able to get what they do not have from other countries through the process of exchange.
- Specialization promotes technological development through innovations and inventionsas a result of continuous use of machines. This leads to efficiency in production.
Disadvantages of specialization
- It leads to boredom. This is because performing the same task all the time becomes monotonous which results into loss of efficiency and work dissatisfaction.
- It is difficult to assess the individual contribution of the worker to the final product under division of labor. This is because many workers contribute in the making of the total final product.
- It leads to loss of craftsmanship. This is because when the job is divided into a series of tasks, one’s skill in making a complete product is lost.
- Specialization leads to unemployment. This is because when a worker is laid off from a certain firm, it becomes very difficult for the worker to get another job in another firm which requires different skills.
- It leads to unnecessary delays in case of breakdown in one department of the firm during the production
- It leads to overproduction especially when markets are limited. This leads to wastage of resources due to excess output which is not sold.
- International specialization promotes over dependence of one country on other countries. This leads to shortage of certain commodities in case there are some misunderstandings among countries.
- It increases occupational labor immobility. This is because workers concentrate on performing one task and with time may not be able to carry out other tasks.
- It leads to loss of responsibility among workers which undermines team work. This is because each worker is concerned about his/her own tasks.
Diversification
In Agriculture, diversification is the raising of the variety of crops or animals as opposed to one enterprise.
Advantages of diversification
- Resources are effectively utilized in the production process.
- Increase supply of raw materials to agro-processing industries.
- It promotes integration of economy when byproducts of one industry are useful to other industries.
- Leads to self-reliance of the farmer and the country.
- Allow production of a variety of food which reduces malnutrition.
- It reduces risks that are associated in producing one type of crop or animal.
- It increases a variety of products produced in a country.
- Provides employment in different enterprises.
- It encourages the participation of many people in the production process to produce the different goods.
- It reduces over dependence on products from one place or country.
- Increase farm productivity and income
Disadvantages of diversification
- The practice is limited by inadequate capital to engage in different enterprises.
- Limited market for a variety of products may affect diversification
- Limited farm implements may discourage diversification
- It’s very difficult to carry out research on a variety of crops and animals to increase their production.
- Climate may not favor the production of various products.
- It encourages subsistence farming which is less profitable.
Cooperatives
This is a registered organization of people who decide to work together for mutual economic benefits.
Types of co-operatives
- Transport co-operatives: These deal with the transport of produce either for the members or for profit from other organizations e.g. Uganda Co-operative transport union.
- Credit savings co-operatives. These deal with savings of members money and provision of small loans e.g. Uganda Women Credit and trust fund.
- Consumer Co-operative. These stock and sell commodities to members at subsidized prices and can also give financial assistance to members.
- Producer co-operatives. These are concerned with the marketing of the farmer /members produce e.g. Busoga grower’s co-operative union, Masaka co-operative union.
- Trade and craft co-operatives. These are mainly concerned with building and construction work.
Principles of cooperatives
These are the basic guidelines to co-operatives
- Open and voluntary membership. All people are free to join or leave the co-operative without hindrance or restriction of any kind.
- Co-operatives are run on democratic principles when electing the leaders i.e. one man one vote basis.
- Interest and profit. The rate of return on borrowed capital should be low since the organization is not a profit making one.
- Capital shares. The financial capital for co-operatives is raised through the selling of shares to the members.
- Co-operation. Co-operatives must work together with other co-operative organizations in order to learn from each other.
- Co-operatives must be neutral in politics, religion or any other bias that can affect their operation.
- Promotion of members. All promotions to places of high responsibility must be based on merit.
- Co-operatives must promote education for their members in order to reduce the rate of illiteracy and also increase the skills needed in running of the co-operative.
- Continuous expansion. A co-operative must have a continuous expansion in terms of members and physical facilities i.e. building machinery.
- Share of dividends. Dividends are shared according to the number of share one has invested.
- Co-operatives can mobilize prices for agricultural products by buying produce during supply and selling it at times o scarcity.
- They can increase investments for the members by buying buildings, estates, factories on behalf of the co-operators.
- They eliminate wasteful competition and exploitation of farmers by middle men hence increasing the farmer’s profit margins.
- They increase the bargaining power of members in the market and protect the weak ones.
Functions of agricultural cooperatives in Uganda
- Saving and credit cooperative provide savings and credit facilities in Uganda
- Produce cooperatives pool farmers for large scale farming
- They transport produce to the market and inputs to the farmers.
- The solicit for market for the farm produce
- Provide storage for farm produce
- Provide training for the members
- Pay dividends to members
- Lobby government for agricultural subsidies.
- Collective purchase lead to lower costs of inputs
Benefits of agricultural cooperatives in Uganda
- Better marketing facilities for farmers’ products
- Easy acquisition of cheap inputs
- Development of leadership skill
- Easy access to cheaper credit
- Easy access to agricultural information and training
- Enhancing farmers’ profits and improving quality of supplies and products.
- Promote production because of availability of market
Problems facing cooperatives in Uganda
- Inadequate skills of management amongst farmers which makes them incompetent in organizing co-operatives.
- Inadequate funds to finance the work for co-operatives which limit the investments and expansion of the co-operatives.
- Embezzlement and corruption by managers has reduced the growth of most co-operatives in Uganda.
- Inadequate transport. Some co-operatives do not have trucks that can easily transport produce to places where there is enough market.
- Shortage of storage facilities. Most co-operatives in rural areas do not have enough stores with facilities like freezers that can help in storing produce.
- Fluctuating prices for agriculture produce. The fluctuation in prices more especially at the world market has affected the income for co-operatives hence their operators hindered.
- High risks and uncertainties in agriculture. These reduce the profit margin fore co-operatives which greatly discourages the farmers.
- Political interference. Some politicians in government have influenced the decision in co-operatives which greatly affects their performance.
- Political Instabilities. In places where there is insurgency it’s been very difficult for co-operatives to operate.
- Dishonesty of members who refuse to pay back the loans or sale their produce to other co-operatives.
- A high competition from private sector which has affected the amounts of profits that can be made.
Solutions to the problems facing cooperatives in Uganda
- More centers for training managers should be set up to equip managers with skills.
- Refresher courses should be organized for cooperative managers
- Co-operative should be provided loans of low interest rates
- Constant auditing should be done so that the managers are made to be more accountable hence reduce embezzlement.
- Self-discipline of politicians should be encouraged to reduce political interference in cooperatives.
- Government should support co-operatives by operating the price stabilization fund in cases of low prices.
- Members borrowing money from co-operatives should present security in order to reduce defaulting.
Basic (fundamental) economic problems (principles)
There are three fundamental economic problems (principles). These include scarcity, choice and opportunity cost
- Scarcity. This refers to limited supply of resources required to produce goods and services required to meet human needs. However, because of scarcity of resources, man decides to meet some of the needs from the available alternatives by making choice.
- Choice. This refers to making right selection from the given alternatives to satisfy human wants basing on the available scarce resources. Choice is determined by the scale of preference. The Scale of preference refers to the list of needs arranged according to the in order of priority (importance), starting with the most pressing needs. By making choice, some alternatives are left out hence opportunity cost.
- Opportunity (Real) cost; this refers to the value of the second best alternative foregone when choice is made basing the available scarce resources. For example if an individual has 100,000/= and she wants to buy two commodities X and Y whereby the price for X is 100,000/= and the price Y is 150,000/=. If he buys commodity X using all his money, she foregoes the value of commodity Y which is worth 150,000/=
Some uses (importance/applications) of the concept of opportunity cost
- It helps the producer in allocation of resources. That is, determining what to produce, when produce, how to produce, where to produce and for whom to produce
- It helps consumers in making consumption choices. That is, consumers choose to buy a commodity that maximizes utility.
- It is used in pricing factors of production. That is, the price of a factor of production must be placed at a higher level than its opportunity cost.
- It is applied in international trade under the principle of comparative advantage in which a country specializes in the production of a commodity where it has the least opportunity cost.
- It is used in planning and budgeting for public and private expenditures in presence of scarce resources.
- It helps workers to make employment decision, based on the opportunity cost of leisure
Limitations of the concept of opportunity cost
- Some factors of production are specific in that they cannot be put to alternative uses.
- It is not applicable where costs and benefits cannot be measured in monetary terms.
- The concept assumes perfect market which is not applicable in the real world.
- It is not applicable in situations where factor immobility exists.
The Production Possibility Frontier (PPF) / (Opportunity Cost curve)
The production possibility frontier (PPF) is a locus of points showing all possible combinations of two commodities that can be maximally produced when all resources are fully and efficiently utilized at a given level of technology,
The PPF assumes the following,
- Production of only two commodities.
- Constant technology
- Full employment of resources.
- Constant prices of commodities
- Perfect mobility of factors of production
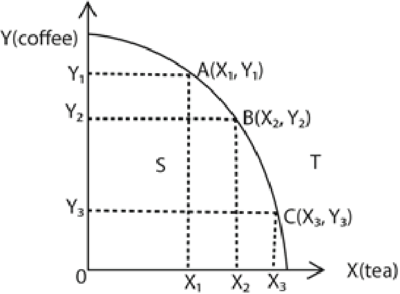
The PPF above shows that all resources are used to produce two commodities X (tea) and Y (coffee). Along the PPF curve, there are various combinations like A, B and C each representing two commodities produced in different quantities or units.
- At point A, more units of Y (coffee) are produced than X (tea). And at point C more units of X (tea) are produced than Y (coffee).
- The PPF curve can be used to explain the concepts of scarcity choice an opportunity cost as follows.
Scarcity: since resources are scarce man is forced to produce along the PPF, that is, man cannot produce beyond the PPF using the available resources and at constant technology,
Choice: since there are so many alternative combinations to be produced along the PPF, man has to choose the appropriate combination from the given alternatives. He may decide to choose either combination at point A, B, C or at any other along PPF
Opportunity cost: Along the PPF, if a man chooses to produce at point A and leaves out point B, then the value of the combination at point B becomes the opportunity cost.
Efficient production; this is represented by all points along the PPF that is; the points along the PPF show the efficient utilization of the available resources. Points inside the curve like point S imply inefficiency in production in form of underutilization of resources. Points outside the curve like T cannot be attained using the available resources and technology.
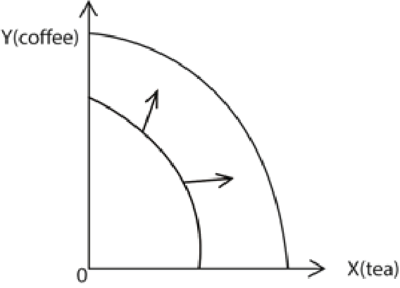
Economic growth: this refers to the persistent increase in the volume of goods and services produced in a country in a given time. Economic growth is illustrated on PPF by the outward shift of the curve to points like T as illustrated below.

The outward shift can be as a result of the following factors
- Improvement in technology through innovations and inventions.
Innovation refers to the improvement on the existing techniques and methods of production while Invention refers to the total discovery of new techniques and methods of production.
- Increase in Labor force.
- Improvement in the existing infrastructure.
- Political stability.
- Discovery of new resources in in the economy,
- Increase in capital stock.
- Improvement in entrepreneurial skills.
- Increase in the efficiency of workers
Market concept
A market is a place where buyers and sellers can meet to facilitate the exchange or transaction of goods and services. Markets can be physical like a retail outlet, or virtual like an e-retailer
Price theory is the study of prices in the market.
Price is the sum or amount of money or its equivalent for which anything is bought, sold, or offered for sale at a given time.
OR.
Price is the amount of money which must be given up in order to obtain a commodity in a given, market at a given time.
Types of Markets
- Competitive (Perfect) market. This is a market where buyers and sellers have no ability to influence the price in the Prices are determined by the market forces of demand and supply.
Characteristics/Features of competitive market
- Large numbers of buyers and sellers in the market.
- Identical/homogenous products sold by all firms,
- the freedom of entry into and exit out of the industry or perfect resource mobility
- Perfect knowledge of prices and technology.
- No price control.
- Perfect mobility of factors of production, the factors of production are completely mobile leading to factor-price equalization throughout the market.
- Cheap and Efficient Transport and Communication
- the consumer has plenty of choice when buying goods or services
- Imperfect market. This is a market where the buyers or sellers have ability to influence the price set in the market by either controlling supply or
- Goods market: This is a market where goods are
- Commodity market: This is a market where goods and services are
- Factor market. This is a market where factors of production are For example land, Labor, capital, entrepreneurship
Note. Factor price is the monetary reward to factors of production for their contribution in the production process. For example wages, interest, profit and rent.
- The spot market is where financial instruments, such as commodities, currencies, and securities, are traded for immediate delivery
- Future (Forward) market. This is a market where commodities are traded for future
Methods of Price determination in the Market in agriculture
- Haggling (Bargaining). This is where the buyer negotiates with the seller for the suitable price of the During bargaining, the seller keeps on increasing the price and the buyer keeps on reducing until the agreed price is reached.
- Auctioning (Bidding). An auction is a sale in which buyers compete for an asset by placing bids. The highest bidder takes the commodity. This is method is common in fundraising especially in churches and other functions.
- Fixing by treaties (Agreements). This is where buyers and sellers come to an agreement to fix the price of the commodity. The price remains fixed for a given time but the agreement can be renewed and prices can be changed.
- Government determination (legislation). This is where the government fixes the price of the commodity. The government can either fix the maximum or minimum price.
- Price leadership. This is where a large and low cost firm in the industry fixes the price of a commodity which has to be followed by other small firms. This firm normally has a large share of the market.
- Price fixing by cartels. A cartel is an organization of firms producing and selling similar products. These firms come together and fix one price at which they have to sell the commodity to the consumers for example OPEC.
- Interaction of the forces of demand and supply. This is where the price in the market is determined by the forces of demand and supply at a point where quantity demanded equals to quantity supplied.
- Resale price maintenance. This is where the producer (manufacturer) fixes the price of a commodity at which the seller (retailers) has to sell to the final consumers. The price is usually written the commodity container. For example Newspapers, soft drinks. etc.
Advantages (merits) of resale price maintenance
- It is time saving since it does not involve bargaining.
- It reduces unnecessary competition among sellers.
- It helps to control consumer exploitation in form of increasing prices by sellers/retailers.
- It helps to maintain price stability.
- It helps to reduce on the duplication of the products by other producers.
Influence of price on agricultural production
- When the prices of farm products are high, farmers are encouraged to produce more and vice versa.
- When prices are high, farmers get a lot of profit leading to high production and growth.
- Farmer are forced to produce products that fetch high prices
- Farmers produce products that have low prices for inputs.
Monopoly Market structure
This is a market structure where there is a single producer or seller of a commodity which has no close substitutes or no substitutes at all, and entry of new firms in this market structure is blocked.
Basis (Origin/Sources) of monopoly power
Monopoly power refers to the ability of the producer to determine the price of the commodity and restrict entry of other producers from entering the market.
The factors which give rise to monopoly power include the following: –
- Patent rights. These are legal barriers where the products of some people like authors; musicians etc. are protected from other producers by law. The law forbids other producers or firms from producing a similar commodity. The producer is given the sole right to produce a commodity or provide a service for a certain period of time without interference from other producers.
- Ownership of a strategic raw material. Some firms or countries may be having the capacity to control the ownership of the only raw material. Therefore they become monopolists in the production of a certain commodity using such a raw material under their ownership e.g. middle east has the monopoly power in oil production.
- Exclusive knowledge of production techniques; in this case a person or firm may possess specific and unique knowledge which may not be possessed by others in the production process e.g. some specialists in the medical field whose services cannot easily be substituted like surgeons.
- Long distance between potential rivals. Long distance can be the source of monopoly power among the producers of the same commodity in different localities. Each producer monopolizes the region in which his production unit is located as other producers from other regions cannot interfere due to long distance.
- Large scale of production. The large efficient and well established firm may adopt the limiting pricing policy which aims at preventing the entry of new firms and elimination of the already existing inefficient firms by charging lower prices for the commodity in consideration. The large scale firm remains a monopolist because other firms are pushed out of the production process.
- Protectionism (trade restrictions). This is where the government imposes tariffs and non-tariff barriers on the imported products so as to reduce foreign competition on the locally produced goods. The home producers therefore become monopolists as they are protected from foreign competition.
- Merging of firms. This is where two or more firms producing related commodities come together to form one firm (collective monopoly). This can be aimed at controlling the materials, market, price of the commodity etc.
- Product differentiation. This is another form where the firm may become a monopolist by supplying a commodity that is differentiated from others by certain trade market or brands.
- Nationalization by the government. In this case, the government can take over private individual firms and therefore it becomes the monopolist. .
- Market limitation. The entry of new firms may be limited due to existence of a small market this is because they may find it uneconomical to and therefore already existing firm remains the monopolist.
- Large capital requirements. Some firms may remain monopolist due to failure of other firms to raise enough capital to start similar businesses e.g. iron and steel industry.
- Long period of training, Monopoly power can be created by restricting entry of new individuals by extending the training period required to join a given profession (industry).
The theory of demand
Demand refers to a consumer’s desire to purchase goods or services and willingness to pay for them at a particular price
Effective demand refers to a customer’s desires to purchase goods and services and ability to pay for them at particular prices.
Quantity demanded. This is the volume of goods and services that consumers are willing and able to buy at a given price in a given time.
Factors affecting the quantity of a commodity demanded for
- The price of the commodity. The higher the price, the lower the quantity demanded and the lower the price, the higher the quantity demanded of the commodity.
- The nature of tastes and preferences. Favorable tastes and preferences by the consumer increase the quantity demanded of the commodity but unfavorable tastes and preferences decrease the quantity demanded.
- The price of related commodities. An increase in the price of the substitute increases the demand for the commodity in question but a reduction in the price of the substitute reduces the demand for the commodity in question. For example increase in price of rice may increase the quantity of maize flour demanded.
- Price of complements. An increase in the price of the complement leads to a fall in the demand of the commodity in question and a fall in the price of the complement leads to an increase in demand for the commodity in question. For instance increase in the price of electricity reduces the number bulbs bought.
- Government policy. An increase in taxes on the commodity by the government leads to a decline in quantity demanded of the commodity but subsidization to consumers by the government encourages the consumption of the commodity and therefore quantity demanded Increases.
- Population size and structure. A population comprised of a big percentage of middle- and high-income earners increases the quantity demanded of the commodity but a population with a big percentage of low-income earners leads to a fall in quantity demanded of the commodity.
- The nature of income distribution. Even distribution of income among the consumers increases the quantity demanded of the commodity but uneven distribution of income reduces the demand for the commodity.
- The level of the consumers’ income. This depends on the nature of the commodity, that is, normal good, a necessity or an inferior good.
- For a normal good, an increase in the consumers’ income increases the quantity demanded of a commodity and the decrease in the consumers’ income leads to decrease in the quantity demanded.
- For the necessity, an increase or decrease in the consumers’ income does not affect quantity demanded of the commodity.
- For the inferior good, an increase in consumers’ income leads to the decrease in quantity demanded and a decrease in consumers’ income increases the quantity For example a fall in customer’s income increases demand of inferior rice.
The three situations are illustrated using the angle curve
- Future price speculation. An expected future increase in the price of a commodity increases its current demand but an expected future reduction in the price reduces the quantity demand for the commodity with the hope of consuming more in future at a lower price.
- Seasonal factors. In certain seasons of the year, the demand for some commodities increases or decreases e.g. in the rainy season, there is high demand for rain coats and their demand decreases in the dry season.
- Religion and culture The demand for pork is low in places where there are many Moslems as compared to places where there are many Christians especially
- Sex of the consumer. Some commodities are demanded by a particular sex e.g. the demand for shirts is likely to be high in places where there are many males as compared to females. Also, the demand for sweets and sanitary pads is likely to be high in a girls’ school as compared to a boys’ school.
- Marital status. For example, the demand for wedding rings is high in a society where there are many married couples as compared to that dominated by singles.
- Level of education. For example, the demand for scholastic materials is high in places where there are many people going to school as compared to places where there are few students.
- Level of advertisement/consumer knowledge.
- Technology: consumers prefer modern technology
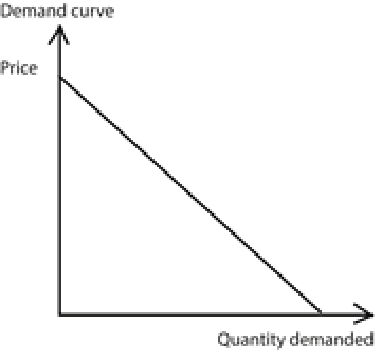
Demand curve
The demand curve is a graphical representation of the relationship between the price of a good or service and the quantity demanded for a given period of time.
The graph shows that increase in price leads to reduction in quantity demanded and vice versa
Change in demand
This refers to increase or decrease in amount of the commodity bought due to changes in other factors affecting demand keeping price of the commodity constant. It involves a shift in demand curve either to the left or to the right.
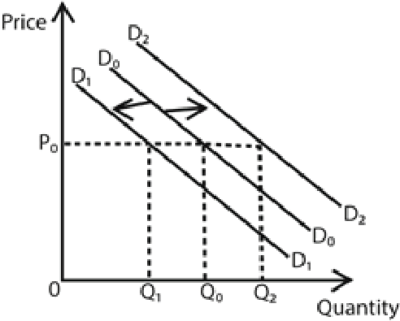
A shift in the demand curve to the right (from D0D0 to D2D2) is called an increase in demand. It refers to the outward shift in the demand curve caused by the favorable factors which affect demand at constant price of the commodity. Such factors include;
- Increase in the price of the substitute
- A fall in the price of the complement
- A favorable change in the tastes and preferences of the consumer
- Expected increase in the future price of the commodity
- An increase in the size of the population
- Favorable season of the commodity
- Favorable government policy like subsidization of consumers
- Increased even distribution of income
- Increase in the disposable income of the consumer
- Increase in advertisement of the commodity
- Increase in the amount of credit facilities offered by the government to consumers.
A shift in the demand curve to the left (from D0D0 to D1D1) is called a decrease in demand. It refers to an inward shift in the demand curve caused by the unfavorable factors which affect demand at constant price of the commodity. Such factors include;
- Decrease in the consumer’s disposable income
- Decrease in the price of the close substitute.
- An increase in the price of the complement.
- Unfavorable change in tastes and preferences of the consumer
- Expected fall in the future price of the commodity
- A decrease in the size of the population.
- Unfavorable season of the commodity
- Unfavorable government policy like increased taxation of consumers.
- Increase in income inequalities.
- Reduction in the advertisement of the commodity
- Withdrawal of credit facilities offered by the government to consumers
Types of demand
- Competitive demand. This is the demand for commodities which serve the same purpose. (Demand for substitutes). For example the demand for tea and coffee, brands of detergents, etc.
- Complimentary (Joint) demand. This is the demand for commodities which are used together. (Demand for complements). An increase in the demand for one commodity leads to an increase in demand for another commodity. For example demand for car and petrol, camera and films, guns and bullets, etc.
- Composite demand. This refers to the demand for the commodity which is used for several (various) purposes e.g. the demand for water, electricity.
- Independent (unrelated) demand. This refers to the demand for commodities which are not related such that the demand for one commodity does not directly affect the demand of another commodity. For example demand for a car and a pen, clothes and sugar.
- Derived demand. It refers to the demand for a commodity not for its own sake, but for its own purposes (uses). For example the demand for factors of production.
- Effective demand. Is the amount of goods the consumer is willing and able to buy at a particular price.
- Elasticity of demand is the change in the quantity demanded resulting from a change in an attribute of a commodity.
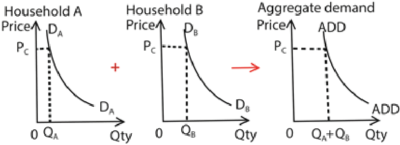
Aggregate demand
Aggregate demand refers to the total demand of finished goods and service produced in an economy by both households and firms
Aggregate demand curve
A demand curve is the locus of points showing total demand of finished goods and service produced in an economy by both households and firms in a period of time. It draws on assumption that the higher the price, the lower the quantity demanded other factors remaining constant.
The factors which affect the level of aggregate demand
- The general price levels in the country: when the general price levels of goods and services are high, aggregate demand lowers and when the general price level is low aggregate demand increases.
- The general level of incomes: when the incomes of households and firms in a country are high, the demand for goods and services are high and vice versa.
- The amount of money supply in an economy: the high supply of money in the country increases the purchasing power of the households and firm raising the aggregate demand.
- The level of aggregate money demand in a country. High level of aggregate money demand reduces the purchasing power of consumers reducing aggregate demand and the vice versa.
- The supply of consumer goods and service. A limited supply of good and services force prices to increase and reduces the aggregate demand and vice versa.
- The distribution mechanism of good and services: When the distribution of goods and services is poor, the level of aggregate demand will be low and vice versa.
- The size of the population: high population increase purchasing power and aggregate demand and vice versa.
- The tastes and If the tastes and preferences are positive for particular goods and service, the purchasing power increases leading to increase in aggregate demand.
- The political climate in the country. A stable conducive political climate increase the purchasing power leading to increase in aggregate demand
- Economic climate. Stable economic climate such as stable prices increase purchasing power and therefore increase aggregate demand.
- Levels of development of the commercial sector. A well-developed commercial sector implies high levels of income leads to an increase in aggregate demand.
- Government polity on taxation and subsidization. When the tax rates in the country are high, this reduces the income of consumers leading to low purchasing power thus reducing aggregate demand.
- The expectation of inflation/speculation:– If the consumer expects high inflation in the future then the demand rises in the present such that the aggregate demand curve shifts rightward.
- Level of Advertising. The higher the level of advertising the higher the aggregate demand
Abnormal (Regressive/exceptional) demand curves
These are demand curves which violate(disobey)the law of demand which state that “the higher the price, the lower the quantity demanded and the lower the price, the higher the quantity demanded keeping other factors constant”. The demand curves normally slope from left to right.
Causes of the Abnormal demand curve
- Demand for goods (Articles) of ostentation. This refers to the demand for expensive luxurious commodities .For example very expensive smart phones. In this case, a further price increase leads to an increase in the demand of the commodity. This is because consumers want to be unique, and they tend to show their economic status by demanding for very expensive items so as to impress the public
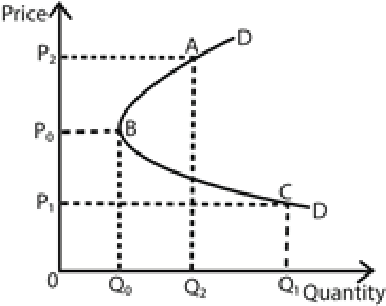
AB is the abnormal part of the demand curve. Further increase in the price from 0P0 to 0P2 leads to an increase in quantity demanded from 0Q0 to 0Q2.
- Giffen good paradox. Giffen goods are inferior goods which take a large percentage of the consumer’s income such that as their prices increase, their quantity demanded also increase and as their prices fall, quantity demand also decreases g. staple food stuffs.

ABC is the demand curve. CB is the abnormal part. An increase in the price form 0P1 to 0P2 leads to an increase in quantity demanded from OQ1 to 0O2.
Future price expectation. When the consumers expect a future price, buy more units of the commodity in the current period even if the prices are slowly. On the other hand, when they expect future price fall, they buy less units of the commodity even if the prices are falling slowly hence violating the law of demand.
- Ignorance effect of the consumers. Some consumers may buy more units of the commodity at high prices due to their ignorance about the existing market This is normally due to persuasive advertisement sellers hence violating the law of demand.
- Depression effect. A depression is an economic situation where all economic activities are at low levels g. low prices, low incomes, low investment levels etc. In such situations when the price of the commodity reduces, quantity demanded remains low due to the low purchasing power of consumers as a result of low incomes. This violates the law of demand.
- Addiction (Habit) to the consumption of the commodity. This violates the law of demand in such a way that increasing the price of the commodity may not reduce the quantity demanded of that commodity to a consumer who is addicted to consuming that commodity, e.g. smokers
- High degree of necessity of the commodity. When the commodity is of high degree of necessity, its demand remains constant even if its price increases or reduces, for example the demand for salt.
- Judging quality by price. Some consumers tend to judge quality by price. Hence they tend to buy more of a commodity whose price is high, thinking that it is of high, quality. This is common in developing countries.
- Special seasons (occasions). For example, during Christmas seasons, wedding occasions In such seasons, the demand for certain commodities increases with an increase in their prices due to high need for them. For example the demand for fruits increases during Idd season.
The supply theory
Supply is the total amount of a given product or service a supplier offers to consumers in a given period and at a given price level.
Supply Schedule refers to the numerical representation showing the quantity supplied of the commodity at various prices in a given time. OR. It is the table showing quantities of the commodity supplied in the market at various prices in a given time.
Hypothetical example to illustrate the supply schedule
| Price | 500 | 1000 | 1500 | 2000 | 2500 |
| Quantity | 20 | 25 | 30 | 35 | 40 |
- From the supply schedule above, as the price increases, quantity supplied also
- From the supply schedule we derive the supply curve by plotting price against quantity supplied.
Supply Curve.
This refers to the graphical representation of quantity supplied of a commodity at various prices in a given time. OR. It is a locus of points showing quantity supplied of a commodity at various prices in a given time.
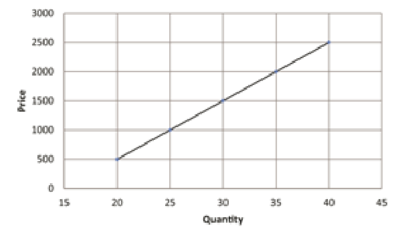
From the graph, the supply curve is positively slopping that is, “it slopes upwards from left to right.
The law of supply states that “the higher the price, the higher the quantity s of product supplied and the lower the price the lower the quantity supplied keeping other factors constant”.
Factors affecting quantity supplied of the commodity
- The price of the commodity. The higher, the higher the quantity supplied and the lower the price of the commodity the lower the quantity supplied.
- The number of producers of the commodity. The higher the number of producers of the same commodity the greater the quantity supplied, and the smaller the number of suppliers, the lower the quantity supplied:
- Level of costs of production. A reduction in the factor prices reduces the cost of production and this leads to an increase in supply but an increase in the costs of production discourages producers and this leads to a fall in the quantity supplied.
- Degree of availability of factor inputs. An increase in the supply of factor inputs in form of raw materials increases quantity supplied of the commodity but a reduction in the supply of factor inputs reduces the quantity supplied of the product.
- Degree of freedom of entry of firms in production. Free entry of firms increases the supply of the commodity while restricted entry of firms reduces the supply of goods.
- Level of technology used in production. Use of better and improved technology increases quantity supplied but in case the technology used is inefficient, the quantity supplied reduces e.g. a tractor versus a hand hoe.
- Nature of the working conditions. Favorable working conditions in form of higher wages, transport and food allowances etc. motivate workers to work hard and this increases quantity supplied of the product. But unfavorable working conditions encourage workers to become inefficient and therefore quantity supplied of the product decreases.
- The length of the gestation period. This is the time taken for a commodity to be ready on market. The longer gestation period, the lower the quantity supplied and the shorter the gestation period, the higher the quantity supplied.
- Goal of the firm. A firm that aims at profit maximization may put less quantity on market and charge a high price hence reducing the quantity supplied of the commodity but for the firm aiming at sales maximization, quantity supplied of the product increases.
- Government policy, increasing taxes by the government on the producers of a certain commodity increases the cost of production and this reduces quantity supplied of the product. But subsidization of producers by the government in form of reduced prices for factor inputs increases the quantity supplied of the commodity.
- The nature of the Climate. Favorable climate increases the supply of the commodity especially for the agricultural products but unfavorable climate reduces the supply of agricultural commodities.
- Degree of political stability of the country. A politically stable country encourages investments and production of goods and services hence increasing the supply of commodities. But a politically unstable country discourages the production of goods and services hence a fall in the supply of commodities.
- The size of the market, the bigger the market size, the higher the supply of the commodity and the smaller the market size, the lower the supply of the commodity.
- Future price expectations. An expected future increase in the price of the commodity by the producers reduces the current supply of the commodity. This is because they expect to sell at a higher price and earn more profits in future. But an expected future fall in the price increases the current supply of the commodity. This is because the producers want to avoid making losses by selling at lower prices in future
Change in quantity supplied
This refers to the increase or decrease in the quantity supplied of a commodity due to change in its price keeping other factors constant. It involves the movement along the supply curve.
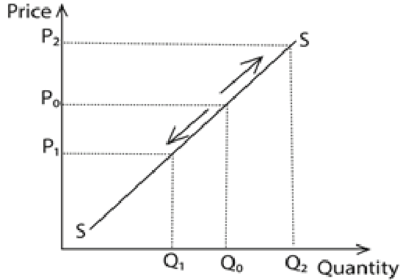
- The movement downwards the supply curve is called a contraction (decrease in quantity supplied). It is brought about by the fall in price of a commodity keeping other factors constant.
- An upward movement along the supply curve is called an expansion (increase in quantity supplied). It is brought about by increase in the price of the commodity keeping other factors constant
Change in supply
Change in supply refers to an increase or decrease in supply due to changes in other factors affecting supply of the commodity at a constant price. OR. It refers to a shift in the supply curve brought about by the changes in other factors affecting supply at constant price of a commodity.
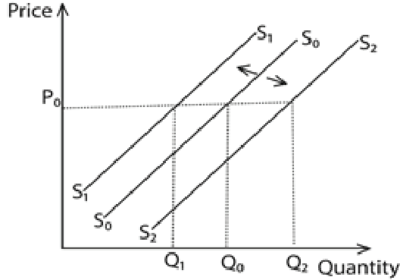
- A shift in the supply curve from S0 to S1 is called a decrease in supply. It refers to the shift in the supply curve to the left caused by the unfavorable factors which affect supply at a constant
- A shift in the supply curve from S0 to S2 is called an increase in supply. It refers to the shift in the supply curve to the right caused by the favorable factors which affect supply at a constant
Types of Supply
- Competitive supply. This is where the supply of one commodity leads to a reduction in the supply of another commodity. For example, increasing the supply of beef at the expense of milk.
- Complementary (Joint) supply. This refers to the situation where the commodities are supplied together. That is, the supply of one commodity automatically leads to the supply of another e.g. beef and hides, mutton and wool.
Regressive (Abnormal/Exceptional) Supply curve
A regressive supply curve is one which the law of supply which states that “the higher the price, the higher the quantity supplied and lower the lower the quantity supplied keeping other factors constant”. It does not slope upwards from left to right.
Examples of regressive supply curves
(a) Fixed supply curve of land in short run

From the graph above, an increase in price from OP1 to OP2 does not lead to an increase in the quantity of land supplied; that is; despite the increase in price, the quantity supplied remains constant at OQ0. It a supply curve for a necessity such as salt
(b) Supply curve for Labor

From the graph, ABC is the backward bending Labor supply when the wage increases from OP1 to OP2 Labor supply increases from OQ1 to 0Q2, after point B, the wage increase from OP2 to OP3 leads to a reduction supply from OQ2 to OQ3
This regressive Labor supply curve is due to the following factors.
- Presence of target workers. These are workers who work only to fulfill their targets or objectives after which they abandon work or decide to work for fewer hours. This violates the law of supply.
- High preference for leisure. As workers earn more wages, they prefer leisure to work and therefore they end up working for fewer hours.
(c) Decline in the real wage of workers due to high levels of inflation. This forces workers to work for fewer hours.
(d) Use of progressive taxation by the government. That is where the tax rate increases as the income of the taxpayer These discourage hard work for high wage earners and are forced to work for fewer hours so as to earn a lower wage and pay fewer taxes.
(e) Speculative supply. When prices are expected to increase in future, sellers or producers put less on market even if prices are slightly increasing. This is because they are expecting to get a lot of profits in future at very high prices. ‘
(f) Supply of perishable goods. For perishables, more is supplied (put on the market) immediately after harvest. Therefore, even if prices are low or decreasing, more is supplied hence violating the law of supply.
(g) Existence of Catastrophic periods. In such periods, supply may not increase even if prices are increasing due to scarcity of commodities.
Market equilibrium
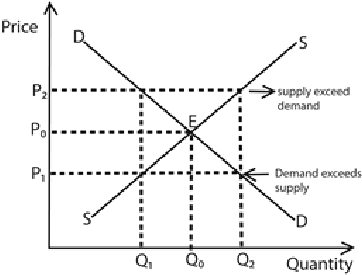
In a competitive market, the market is in equilibrium when quantity demanded equals quantity supplied. This is graphically illustrated as shown below
- At high price OP2 supply exceeds demand and therefore a surplus of Q0Q2 is When supply is in excess, the producers decrease the price in order to sell the surplus (excess) and in the process equilibrium is restored in the market at point E.
- At lower price OP1, quantity demanded exceeds quantity supplied therefore a shortage Q1Q0 is created which forces the producer (seller) to increase the price until the equilibrium point is attained at point E.
Note
- Market price refers to the prevailing (ruling) price in the market at a given time. Market price is any price determined by the buyers and sellers in the market irrespective of whether quantity demanded is equal to quantity supplied at a given.
- Equilibrium price refers to the market price where quantity demanded is equal to quantity supplied.
- Normal (natural) price refers to the long run equilibrium price established in the market after a long period of price fluctuations.
- Reserve price refers to the minimum price set by the seller below which he is not willing to sell his commodity.
- Reserve wage refers to the minimum wage set by a worker below he is not willing to work/offer services.
The theory of elasticity
Elasticity is the measure of degree of responsiveness of variable due to changes (variations) in the independent variable(s).
In the theory of demand and supply, quantity supplied, and quantity demanded are said to be dependent variables while their determinants like price of the commodity are said to be independent variables.
There are two broad categories of elasticity. These include:
1) Elasticity of demand
2) Elasticity of supply
Elasticity of demand
This is the measure of degree of responsiveness of quantity demanded due to changes in the factors which influence quantity demanded.
Types of Elasticity of demand
(a) Price elasticity of demand (b) Point elasticity of demand (c) Arc elasticity of demand (d) cross elasticity of demand (e) Income elasticity of demand
(a) Price elasticity of demand
This is the measure of the degree of responsiveness of quantity demanded due to changes in the price of the commodity.

The negative is multiplied in the formula because of the negative relationship between quantity demanded and the price of the commodity.
Examples 1
A change in price form 10/= to 15/= lead to a reduction in quantity from 24 to 20. Calculate price elasticity of demand
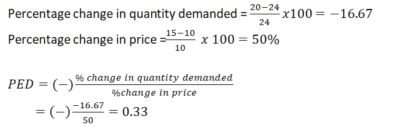
Example 2
A 20% change in price of a commodity led to a fall in quantity demanded of the commodity from 40 to 20 units. Calculate price elasticity of demand.
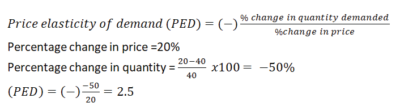
Interpreting price elasticity of demand
(i) Perfectly inelastic demand (EP= 0). This is when price elasticity of demand equals to zero. Here the quantity demanded does not respond to changes in price at all.
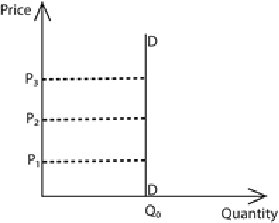
From the graph a change in price from OP1 to OP2 to OP2 leaves quantity demanded unchanged at 0Q0.
(ii) Inelastic demand (0 < Ep <1)
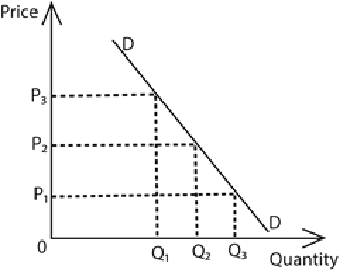
In this case, the price elasticity of demand is greater than zero but less than one. A big proportionate change in price leads to a smaller percentage change in quantity demanded.
(iii) Unitary elasticity of demand
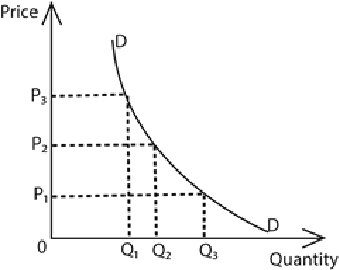
In this case, the price elasticity of demand equals to one. The percentage change in quantity demanded equals to the percentage change in price. It is illustrated by a rectangular hyperbola.
(iv) Elasticity of demand (1 < Ep < ꝏ)
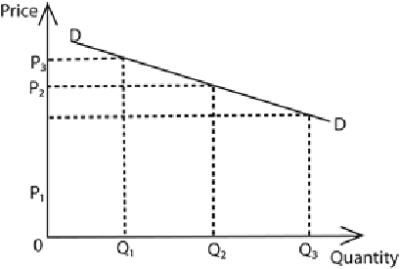
In this case, the price elasticity of demand is greater than one but less than infinity or is between one and infinity. A big percentage change in quantity demanded is due to a small percentage change in price
(v) Perfectly elastic demand (Ep = ꝏ)
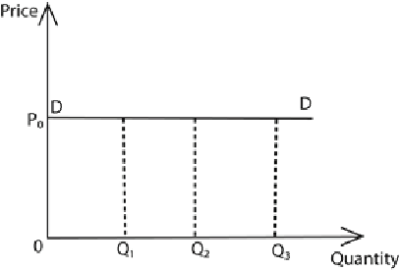
(b) Income elasticity of demand
Income elasticity of demand is the degree of responsiveness of demand of a commodity due to a change in Consumer’s income.
It is obtained as a ratio of the percentage change in the quantity demanded of a commodity to the percentage change in the customer’s income

Interpretation of Income elasticity of demand
- If YED > 0 (positive): the commodity is a normal good. The demand for normal good increase as the consumer’s income increase.
- If YED < 0 (negative): the commodity is an inferior good. The demand for an inferior good reduces as the consumer’s income increases.
- If YED = 0: the commodity is a pure necessity. The increase in consumer’s income has no effect on the quantity demanded for a pure necessity such as salt.
Example 5
An increase in the consumer’s income from 1000/= to 1800/= led to an increase in the quantity demanded of commodity X from 20 to 30.

Example 6
A 10% decrease in consumers income led to an increase in quantity demanded of commodity P from 25 to 32.
(i) Calculate the income elasticity of demand of commodity P
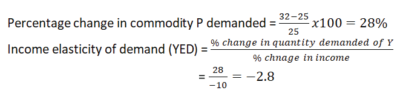
(ii) State the nature of commodity P
P is an inferior good
Example 7
| Income | Quantity demanded of commodity P |
| 250 | 50 |
| 600 | 25 |
(i) Calculate the income elasticity of demand of commodity P
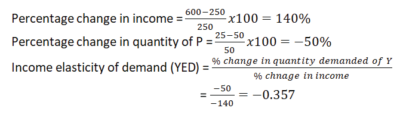
(ii) What is the nature of commodity P
P is an inferior good
Determinants of price elasticity of demand
- Level of consumers’ income. The higher the level of consumers’ income, the lower the elasticity and the lower the level of income, the higher the elasticity of demand (elastic).
- Degree of necessity of the commodity. The higher the degree of necessity of the commodity likes salt, the lower the elasticity of demand (inelastic) while the lower the degree of necessity of the commodity the higher the elasticity of demand (elastic).
- Degree of availability of substitutes. The demand for a commodity with many substitutes tends to be elastic while the demand for a commodity with few or no substitutes tends to be inelastic.
- The cost of the commodity. The demand for the commodity that takes a small proportion of the consumers’ income tends to be inelastic. For example elasticity of demand for a match box is inelastic. On the other hand, the demand for a commodity that takes a large proportion of consumers’ income tends to be elastic.
- Habit (addiction) in the consumption of the commodity. The demand for the commodity for which the consumer is addicted to tends to be inelastic for example a consumer who is addicted to the consumption of cigarettes. On the other hand, the demand for the commodity for which the consumer is not addicted to tends to be elastic
- Number of uses of the commodity. The demand for the commodity that has many uses “tends to be elastic. For example, if the unit price of electricity increases, consumers use less of it for only vital purposes for lighting: On the other hand, the demand for the commodity that has few uses tends to be inelastic.
- Degree of durability of the commodity. The demand for a durable commodity tends to be inelastic. This is because even if the price of such a commodity falls, the consumer may not demand more of that commodity because he already has that commodity. On the other hand, the demand for a perishable commodity tends to be elastic.
- Level of advertisement for the commodity. The demand for a commodity that is highly advertised tends to be inelastic but the demand for the commodity that is not highly advertised tends to be elastic.
- Future price expectations. The demand for the commodity whose price is expected to decrease in future makes its current demand to be elastic but the demand for the commodity whose price is expected to increase in future makes its current demand to be inelastic.
- The demand for a commodity whose use can be postponed. The demand for the commodity whose use can be postponed to a future date tends to be elastic but the demand for the commodity whose use cannot be postponed tends to be inelastic.
- Time period. In the short run, the demand for the commodity may be elastic because the consumers are not yet used to the new product on the market while in the long run the demand for such a commodity may be inelastic after the consumers getting used to the product.
- Level of consumers’ ignorance. Consumers may buy commodities at a high price when they do not know where such commodities or their substitutes are sold. Consumers may also mistake the increase in the price to be a result of increase in the quality of products which may not be the case. Consumers’ ignorance therefore leads to low elasticity of demand of commodities.
- Degree of convenience in obtaining the commodity. The higher the level of convenience, the lower is the elasticity of demand and the lower the level of convenience, the higher the elasticity of demand.
Elasticity of supply
Elasticity of supply refers to the degree of responsiveness of quantity supplied due to changes in the factors which influence supply
Price elasticity of supply is the measure of the degree of the responsiveness in quantity supplied due to changes in the price of commodity supplied

Example 6
An increase in the price of sugar from 100/= to 120/= per kilogram lead to an increase in the quantity supplied of sugar from 30kg to 40kg. Calculate the price elasticity of supply.
Solution
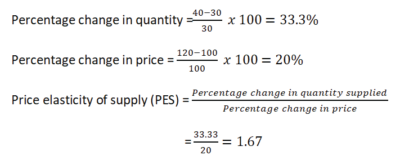
Example 7
An increase in the price of commodity by 40% causes an increase in quantity supplied of sugar from 200kg to 250kg. Calculate price elasticity of supply.
Solution

Interpretation of price elasticity of supply
(a) Perfectly inelastic supply (ES= 0).
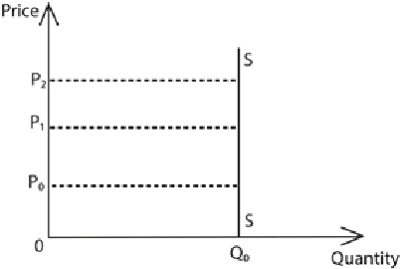
In this case, quantity supplied does not respond to changes in price. For example, the supply of agricultural products in short runs.
(b) Inelastic supply (EP= 0 < ES < 1).
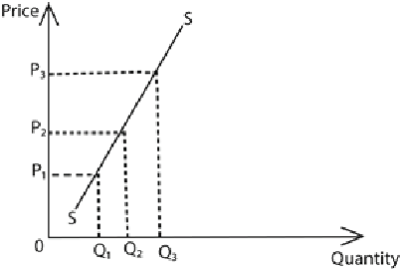
In this case, a big proportionate change in price leads to a small proportionate change in quantity supplied
(c) Unitary supply (ES = 1)
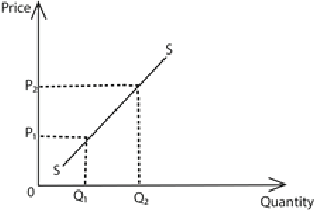
In this case, a percentage change in price leads to an equal percentage change in quantity supplied
(d) Elastic supply

In this case, a small percentage change in price leads to a big percentage change in the quantity supplied.
(e) Perfectly elastic supply
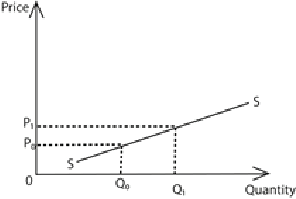
In this case, at constant price, quantity supplied increases. This situation is not applicable in the real world.
Determinants of Price Elasticity of supply
- Cost of the higher the cost of production, the more inelastic the supply of the commodity and the lower the cost of production; the higher the elasticity of supply.
- Gestation period (Length of the production process). The longer the gestation period, the lower is the elasticity of supply and the shorter the gestation period, the higher the elasticity of supply.
- Level of technology. The higher the level of technology e.g., use of modem techniques of production the higher the elasticity of supply while the lower the level use of inelastic production techniques) the lower the elasticity of supply
- Degree of availability of factor inputs. The supply of the commodity whose factor inputs are readily available tends to be elastic but the supply of the commodity whose inputs are scarce tends to be inelastic.
- Degree of entity of firms in the production process. Free entry of firms in the production process increases the number of producers of the product hence elastic supply while restricted entry of firms in the production process leads to inelastic supply e.g., the case of a monopolist.
- Degree of factor mobility. Factor mobility refers to the ease with which a factor of production be changed from one occupation/geographical location to another. Highly mobile factors of production make the supply of the commodity elastic while immobile factors of production make supply inelastic.
- Government policy of taxation. High taxes imposed by the government on producers increase the cost of production hence inelastic supply. However, subsidization of producers by the government reduces the cost of production hence elastic supply.
- Price expectation. An expected future price fall by the producer relative to the current prices makes the current supply of the commodity elastic. But the expected future price increase by the producer relative to the current prices makes the current supply inelastic.
- The nature of the product (commodity). Durable commodities have elastic supply. This is because they can be stored for a long time and any increase in price is accompanied by an increase in price. On the other hand, perishable commodities have inelastic supply because they cannot be stored for a long time such that if there is an increase in price nothing can be supplied.
- Objectives of the firm. A firm whose objective is to maximize sales is associated with elastic supply of the commodity while a firm whose objective is to maximize profits, the supply of the commodity tends to be inelastic.
- Time. This can be short run or long run. In the long run supply becomes elastic since producers have enough time to the factors of production so as to increase output but in the supply is inelastic because it is difficult to change the fixed factors of production in order to increase supply.
Price discrimination (Parallel pricing)
Price discrimination is the process (practice) of selling the same commodity to different consumers at different prices by the same seller in a given period of time, for reasons not associated with costs. For example, prices of entertainment tickets at different costs for public and students or children and adults.
Conditions necessary for Price discrimination to succeed
- The commodity should not have close substitute.
- Businesses must prevent resale. Prevention of re-sale could be enforced in many different ways. For example, students can only receive student discounts with a legitimate student ID, children can easily be identified from adults.
- The market in question must be geographically distant /spatially separated in case of seats for football or entertainment such that it is easy for monopolist to charge different prices in the different marketplaces or transfer of goods from one market to another is difficult
- There should be different elasticity of demand in the different markets.
- Ignorance among customers about other markets
- The seller or producer must be a monopolist, or the market must be imperfect.
- Personal services that can be resold or transferred e.g. medical Doctor, teacher, entertainment etc.
- Product differentiation: artificial differences made on similar products by a way of branding, trademarks.
- Low transport costs also lead to monopoly power in that goods can be transferred from one market to another without affecting their prices.
- No government interference
Forms (Basis) of Price discrimination
- Price discrimination according to personal income. This is where different prices are charged to different income groups for example charging low prices to the low-income earners and high prices to the rich for the same service.
- Price discrimination according to sex and age. This is where different prices are charged for different sexes or ages for example higher charges may be fixed on tickets for a football match for adults and lower charges for the children, lower charges on tickets a dance for females and higher charges for males.
- Price discrimination according to status. Students or soldiers in uniforms may be charged lower than other groups of people for certain services like transport and entertainment.
- Price discrimination according to geographical factors. Price discrimination may be geographical, for example dumping where commodities are sold at lower prices in a foreign market as compared to the one charged in the domestic market.
- Price discrimination according to time of service. This is where different prices are imposed on consumers when getting services at different times or period e.g. film shows tend to be more expensive on weekends as compared days, evening dances are more expensive as compared to dances organized during daytime.
- Price discrimination according to use. For example, during transportation, low transport charges can be charged on essential commodities and high transport charges for luxurious commodities.
- Price discrimination according to differentiation of product. This is where consumers are charged differently according to the class. For example seats in air transport, first class seats are charged higher amounts as compared to other classes.
- Price discrimination according to the nature of the product. For example, packed commodities are charged higher amounts as compared to unpacked commodities even if they are of the same quality.
Advantages (Merits) of Price discrimination
- Price discrimination increases the total revenue of the monopolist. This is because, output sold increases due to the act of charging different prices to different consumers of similar units of the same commodity. .
- It helps to reduce income inequalities. This is because the rich consumers are charged higher prices and the low income earners are charged low prices.
- It enables the low income earners to get essential commodities at fair prices e.g. medical services, transport and housing etc.
- Price discrimination helps producers or countries to dispose of the surplus output through the process of dumping. Dumping is important to the producer because it encourages exploitation of resources within the home country by widening the external market for goods and services.
- The profits earned by a monopolist through price discrimination can be used to expand on the business and to improve on the welfare of the workers.
- Price discrimination increases quantity sold and consumed example for electricity, the first units are charged a high price as compared to the extra units. Therefore, the more units you use, the less charge you incur for the extra units.
Disadvantages (Demerits) of price discrimination
- Price discrimination leads to the provision of poor-quality services especially to the low-income earners. This is because there is no competition since it is carried out by a monopolist.
- Price discrimination based on dumping retards the development of young industries in a country where the commodities are dumped. This is because consumers may prefer the cheap dumped commodities as compared to the expensive locally produced commodities.
- Price discrimination on the international market leads to the consumption of harmful and expired commodities for example cheap expired drugs or food stuffs sold to developing countries by developed countries.
Engel curves
Engel curve describes how household expenditure on a particular good or service varies with household income
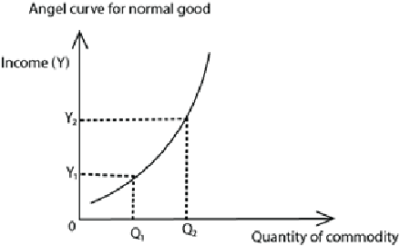
Quantity demanded for the commodity increases as household income increase
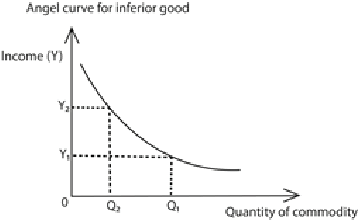
Quantity demanded for the commodity decreases as household income increase
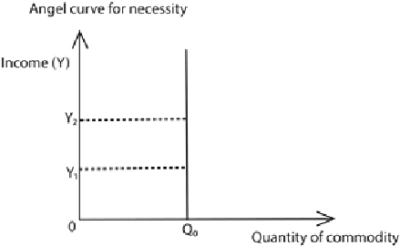
Quantity demanded for the commodity remains unchanged as household income change
Effects of agricultural price fluctuation in Ugandan economy
- Farmers get discouraged
- Leads to fluctuation of government revenue from agricultural related products
- Leads to unemployment because people abandon agriculture
- Leads to unstable export earnings
- Unstable terms of trade since the cost of imports remain constant
- Make planning agriculture difficult leaving it to mere speculation
- Encourages rural-urban migration search of job with stable income
- Reduced production because price fluctuation discourage investment in agriculture
- Income inequality rises because some become rich others poor due to agricultural price fluctuations.
- Make it hard to pay back agricultural loans
- Make it hard for banks to avail agro based loans
Reasons to stabilize prices of agricultural products
- to stabilize incomes of farmers
- to stabilize balance of payment
- for stabilize government revenue
- to stabilize foreign exchange earnings
- to control rural-urban migration
- to minimize unemployment
- to discourage speculations in the agriculture
- to ensure stable foreign exchange rate
- to encourage investment in agriculture
Measures that can be adopted to stabilize agricultural prices
- Buffer stocks. The government should buy up part of the supply when output is in excess, store this surplus and later sells it to the consumer in times of reduced supply.
- Stabilization fund. The government through marketing boards can maintain or increase prices of agricultural products, depending on world market prices. If profits are made, they are saved and used to stabilize prices and incomes of the farmers.
- A variety of agricultural activities should be introduced e.g. crop farming, poultry, animal husbandry etc. to reduce over dependence on one or a few sources of agricultural income in a bid to stabilize farmers’ income.
- Encourage formation of cooperatives to bargain fair prices
- Introduce irrigation schemes to ensure continuous supply of agricultural products.
- Stability in prices of agriculture can also be attained by improving transport system to enable easy marketing
- There is a need to improve, develop and expand storage facilities to accommodate excess output in agriculture.
- Price control. Government should establish the minimum and maximum prices for agricultural output.
- Market expansion. Government should expand agricultural output market through economic integrations
- encourage further diversification of agriculture
Challenges encountered by government while stabilizing the price of agricultural products in Uganda
- conflicts with the policy of liberalization
- standardization of quality and quantity of the produce
- inadequate funding
- poor road and communication network
- need to process agricultural produce and extend self-life
- shortage of storage facilities
- competition from synthetic substitutes
- lack enough market for the produce
- high illiteracy rate among farmers
- subsistence production/low product quantities
- limited diversification of agricultural production
- corruption and embezzlement
Ways of improving the marketing of farm products in Uganda
- Providing adequate market information i.e. the buyer should be informed of availability of the produce.
- Standardization of the quality and package of products.
- Improvement of transport network to enable transport of produce to the market
- Processing to increase value and lifetime of produce
- Formation of marketing cooperatives that help farmers to improve quality, source for the market and bargain for good prices
- Improving on security of the country to allow free movement of traders.
- International integration to increase market for produce
- Promoting agro-industries to provide market for agricultural produce
Concept of the firm
- A firm is a production unit under one management which organizes resources to produce goods and services.
- An industry is a collection of firms dealing in related products for example foot wear industry plastic industry, textile industry etc.
Types of industries
- Rooted Industries. These are industries located near the source of raw materials e.g. Cement industries located near lime stone rocks, sugar industries located near, sugar cane plantations
- Footloose Industries. There are industries which can be located anywhere without considering the source of raw materials or market.
- Tied Industries. These are industries located near the market for their finished products e.g. furniture industries, bakeries, carpentry workshops soda industry, etc.
Objectives of the firm
- Profit maximization. This is a major objective of the firm. The firm tries to minimize the costs and maximize the revenue the revenue in order to maximize profit. Profits are maximized at a point where marginal cost equals to marginal revenue.
- Sales revenue maximization. The firm may aim at increasing sales through reduced prices, advertisement and other incentives given to customers with the aim of maximizing the sales revenue.
- Good image. Some firms do not aim at profit making but to serve the community and maintain their reputation especially parastatals. This can be achieved by fixing low average prices, providing quality products and services that are appropriate to community needs.
- Market expansion. Firms aim at getting a bigger market share as compared to their competitors through market research, supplying good quality products, advertisement etc.
- Long run survival. The firm may operate in such way to exist for a long time. This can be achieved through proper management and making proper decisions.
- Entry limitation. Some firms are interested in preventing other firms from entering the industry. This is achieved by setting lower prices that make entry of new firms in the-industry un attractive. This is referred to as limiting pricing policy.
- Employee welfare maximization. Some firms aim at maximizing the welfare of their workers increasing the wage and non-wage benefits,
Survival of small-scale firms alongside large firms
As firms increase their scale of operation, they enjoy economies of large scale. Therefore, every firm must strive hard in order to reap such benefits. However, some firms continue to operate on a small scale because of the following factors.
- Limited capital. Small firms may be limited by capital for their expansion and this makes them to remain small for a long time.
- Limited Market Size. Some firms may remain small due to a small market size which necessitates the production of low output. Therefore the firm remains small to avoid loss resulting from over production.
- Using bi-products from large firms. Small scale firms may survive When they are using raw materials supplied by large firms. This makes them to remain in a small state despite the benefits of large production.
- Providing personalized services. Small scale firms which provide personal services and pay individual attention to their customers like doctors, tailors may not need to operate on a large scale if they are to provide standardized services to their customers.
- Need for personal contact. The owners of small scale firms can easily develop personal contacts with their customers. This may help the firms to keep on operating unlike large firms where the owners may not develop personal contacts with their customers e.g. salons.
- Simplicity in management. Small scale firms are easy to manage that is there is easy communication and co-ordination within the small firm unlike large firms.
- Beginner firm. When the firm has just started, it operates on a small scale because time is required for it to expand and enjoy the economies of large scale.
- Fear of diseconomies of scale. Unlike large scale firms, small firms do not face internal diseconomies of scale and therefore, this forces them to small for a long time.
- Production of very expensive products. Firms engaged in the production goods of ostentation may remain small because of the nature of their expensive products and the need to show class among their customers. Examples are firms dealing in sports cars, expensive jewelry etc.
- Flexibility in production. Small scale firms can easily change the line of production without wasting much resources for example when the market demand changes, a small firm does not lose so much as compared to a large firm,
- Production of bulky and fragile products. Small scale firms dealing in bulky and fragile products may feel secure to remain small to avoid risks of over expansion e.g. Firms dealing in glass making, brick making, eggs etc.
- Fear of paying taxes to the government. Small firms can easily avoid and evade paying taxes and this makes them to operate on a small scale.
Merging (Integration) of firms
This is where two or more firms join together to form one business unit with the aim of enjoying economies of large scale.
Reasons (Aims/Objectives) for merging/integration
- To expand the market in form of increased sales resulting from large production.
- To ensure efficient management, that is, different firms can combine different management skills which enable them to operate more effectively and efficiently.
- To reduce on the risks involved in business operations. This is because under mergers risk bearing economies of scale can be enjoyed through diversification in production.
- To monopolize business activities. When a number of firms combine to form one large firm, they can outcompete other small firms hence enjoying the monopoly power.
- To increase employment opportunities. A number of business activities are created due to large scale of production hence more employment opportunities.
- To increase resource utilization. A combined big firm can be able to raise more capital in order to increase on the utilization of resources and produce more goods and services, in case small firms have been operating at excess capacity.
- To ensure reliable supply of raw materials, for example when one firm is using bi-products of another firm as its source of raw materials.
- To increase on the profits of each firm within the merger due to the large scale of operation of the merger.
- To ensure increased quality and quantity of output. For example, through joint research, firms can be able to improve on the quality of their products.
- To promote specialization in production. Each firm under the merger can specialize in producing a given product. This increases the efficiency and output of each firm.
Factors which make it difficult for firms to Merge
- Fear of complexity in management in form of bureaucracy
- Fear of losing independence enjoyed by individual firms
- Differences in aims and objectives of individual firms
- Government policy which may be aimed at discouraging merging of firms
- Fear of losing employment due to merging for example the managers
- Fear of paying high taxes by one single big firm
- Fear of losing personal contact with the clients of the firm.
- Fear of under taking high risks associated with large scale operation
- Fear of not achieving the optimum level of production due to a large scale of production
- Fear of diseconomies of large scale. For example marketing and technical diseconomies of scale
- Market potential may favor competition which forces firms to remain independent.
Advantages of merging of firms
- It helps to expand the market in form of increased sales resulting from large firms.
- It increases employment opportunities as a result of large scale production.
- It increases utilization of resources hence increased output.
- It helps to minimize unnecessary competition among firms producing related products in form of duplication of commodities.
- It ensures reliable supply of raw materials.
- It improves efficiency in management. This is because people of different expertise and experience are combined together under the merger.
- It reduces the cost of advertising for individual firms.
- It enables firms to carry out research jointly at a reduced cost.
- It enables firms to access capital (loans) from financial institutions as a result of merging.
- It enables the firms to share risks involved in production.
- It enables firms to access the use of better techniques of production.
- It increases profits of each firm due to large scale production.
- It promotes specialization among firms which increases the level of output.
Disadvantages of merging of firms
- It leads to over exploitation of resources.
- It increases pollution due to the existence of the industry.
- It leads to congestion of firms within the industry.
- It leads to over production due to large scale production hence wastage of resources.
- It leads to price fluctuations due to over production.
- It leads to loss of independence of individual firms
- It increases complexity in management due to large scale operation.
- It leads to emergency of collusive monopoly and its associated negative implications
- It leads to unemployment in firms when the firms use capital intensive techniques of production.
Location of firms (Industries)
This refers to the setting up of a firm in a particular area.
Factors affecting the location of firms
- Availability of raw materials. In situations where the raw materials are bulky the firm finds it cheaper to be near the source of raw materials. For example the location of cement factory in Tororo was due to the presence of limestone rocks.
- Availability of power supply. Industries which require a lot of power are located near source of power, for example, industries manufacturing metal products like steel rolling mills. This explains why Jinja became the industrial town of Uganda due to the presence of hydroelectric power source.
- Availability of market. Industries or firms producing perishable commodities like flowers, bread etc. are located near the market to avoid their products from getting spoilt or damaged while in transit. In addition, industries producing fragile and bulky commodities like glass and bricks need to be located near market areas.
- Availability of transport facilities. There is need to locate a firm where transport is readily available and cheap .For example along railway lines, good road networks, water ways etc. This helps to minimize on the transport costs.
- Availability of water supply. Some firms require water as a raw material in the production process, for example, water is used as an input in the brewery industry and it can be used for waste disproval by many industries. Therefore, it is economical for some industries to be located near a water source.
- Availability of land. Land provides a site where a production unit can be established. Therefore it is economical for firms to be located in areas where land as available and cheap so as to provide room for industrial expansion.
- Availability of cheap Labor. Firms are located in areas where Labor is cheap and is in enough supply. This is true with firms which are Labor intensive.
- Government policy. The government may be aiming at balanced regional development, employment creation, controlling rural urban migration which may force the government to locate a firm in a certain area.
- Political climate. The location of a firm is determined by political stability (security) of the area. This is because a politically stable area provides a conducive investment climate which attracts firms to be located in a certain area.
- Availability of economic infrastructure. For example banks, insurance companies, advertising companies etc. may force firms to concentrate in an area.
- Availability of suitable climate. Firms are located in areas where the climate is generally favorable for their activities. For example, it is not advisable to locate a paper industry in a swampy area.
Localization of firms
This refers to the concentration of firms in a particular area.
Factors which influence the localization of firms
- Industrial inertia. This is the tendency of the existing firms to remain established in a given area even when the location factors are exhausted.
- Availability of ready market. The already established firms may provide market for the incoming firms and the new firms may provide raw materials for the already established firms and therefore such firms may decide to localize in one area.
- Power supply. Availability of cheap and constant power supply may lead to the concentration many firms in one area.
- Availability of enough land. When land is available and cheap, many firms concentrate in that area because of the existence of room for expansion.
- Availability of supply of skilled and unskilled Labor. When Labor is readily available, and in large quantities, many firms may be established in that area hence localization e.g. many firms are concentrated in Kampala.
- Security and political stability. Localization of firms may be due to constant security and political stability which attract many firms in a particular area.
- Availability of water supply. Water is needed for industrial purposes in various ways, for example, it is used an input, for waste disposal, a cheap means of transport etc. This can attract firms to concentrate in such an area so as to minimize on production costs.
The revenue concept of the firm
Revenue is the receipts (returns) derived from the sale of a given level of output at a given price in a given time.
Terms used under revenue
Total Revenue (T.R); this is the total amount of money the firm receives from sale of its output. TR = P x Q Where P = Price of each unit of output and Q = total out put
Average Revenue (A.R); refers to total revenue per unit of output sold
Note: Average revenue is the same as price under perfect competition
Marginal Revenue (MR.) refers to the additional revenue resulting from the sale of an extra unit of output.

Example
| Output | TR | AR | MR |
| 1 | 500 | 500 | – |
| 2 | 800 | 400 | 300 |
| 3 | 1000 | 333 | 200 |
| 4 | 1300 | 325 | 300 |
| 5 | 1600 | 320 | 350 |
The theory of costs
A cost in economics refers to amount of money paid (incurred) by the firm to produce a given level of output in a given time. Therefore, costs are expenses of the firm in the production process. A firm’s cost of production also includes all the opportunity costs of producing its output of goods and services.
Types of costs of a firm
Implicit (transfer) costs. There are costs which are not considered when calculating profits of the firm by the accountants e.g. costs in form of, family Labor, self-owned inputs, etc. They are normally assumed to be zero when computing profits.
Explicit (nominal/money) costs. These are costs which are considered when calculating profits of the firm by the accountants e.g. costs of raw materials, hired Labor, transport costs etc.
Note. Explicit cost can either be fixed costs or variable costs.
Fixed (Supplementary/Overhead) costs. These are the costs incurred by the producer irrespective of the level of output. OR These are costs which remain constant irrespective of the level of output. For example, the cost of land, rent, building, vehicles, salaries for top management, rent.
Variable (Prime) Costs. These are costs which change with the changes in the level of output, that is; when the level of, variable costs costs also for example the cost of raw materials, wage , electricity etc.
Total costs (TC) = Explicit costs + Implicit costs
Total costs (TC) = Total Fixed costs (TFC) + Total Variable costs (TVC) + Implicit costs
Assuming that implicit costs = 0
TC =TFC + TVC.
Assuming zero implicit cost, TC = TFC + TVC.
When output is zero as shown from the graph, there are no variable costs (TVC = 0). This implies that the producer has not yet started producing and therefore he cannot incur any variable cost. Therefore Total Cost = 0 + Total Fixed cost (TC = TFC).
When output increases, TVC and TC increase by the same amount. This is because TFC are constant at all levels of output and an increase in TC results from the increase in TVC.
Variation of costs in the short run
In the short run, there are both variable costs and fixed costs of production. This is because some factors of production are variable and others are fixed.
Average Fixed Costs (AFC): These are total fixed costs incurred in producing an extra unit of output in a given time. Or these are fixed costs per unit output produced by the firm in a given time
AFC =
Example 1
Given TFC = 8000/= and output = 20kg, find AFC
AFC =
Average variable costs (AVC) are total variable costs per unit of output produced in a given time. Or average variable costs are total variable costs incurred in producing in producing one unit of output in a given time.
AVC =
Example 2
Given TVC = 10000/= and output is 200kg, find AVC
AVC =
Marginal cost refers to additional costs resulting from the production of an extra unit of output in a given time
MC =
Example 3
Given that output increased from 50kg to 75kg and total costs increased from 20,000/= to 25,000/=. Calculate MC.
MC =
Average total cost (ATC/AC) is the total costs of production per unit of output produced by the firm in a given time. Or average total costs are total costs incurred in producing one unit of output in a given time.
ATC = AC =
Example 4
Given that TC = 400/= and output is 20 units, calculate ATC (AC)
ATC = AC =
Not that
TC = TFC + TVC;
Divide through by Q
= +
- ATC = AFC + AVC
Numerical example to illustrate the short run variation of costs of a firm
| Output Q | TFC | TVC | TC | MC | ATC | AFC | AVC |
| 0 | 100 | 0 | 100 | – | – | – | – |
| 1 | 100 | 400 | 500 | 400 | 500 | 100 | 400 |
| 2 | 100 | 700 | 800 | 300 | 400 | 50 | 350 |
| 3 | 100 | 900 | 1000 | 200 | 333 | 33 | 300 |
| 4 | 100 | 1200 | 1300 | 300 | 325 | 25 | 300 |
| 5 | 100 | 1550 | 1650 | 350 | 330 | 20 | 310 |
| 6 | 100 | 2000 | 2100 | 450 | 350 | 17 | 333 |
From the graph, MC, ATC and AVC curves are U – shaped because of law of diminishing returns
- AVC curve lies below ATC curve because AVC is part of ATC.
- As output increases the AVC curve comes closer to the ATC curve because of the continuous fall of AFC.
- The MC curve lies below the ATC and A VC curves when they are declining and it lies above them when they are rising.
- The MC curve cuts the AVC and ATC curves at their lowest (minimum) points (points A and B respectively).
- The minimum point of the A VC curve (point A) is on the left hand side of the minimum point of the ATC curve (point B).
- The ATC curve first decreases as output increases because of the fall in A VC and AFC. After point A, the AVC curve begins to rise but the ATC curve continues to fall because of the continuous fall in AFC which outweighs the rate at which AVC is increasing.
- After point B the A TC Curve begins to rise because of the increase in A VC outweighs the rate at which AFC is falling.
Non-price competition in agriculture
This is where rival firms compete using other means other than changing (adjusting) the price of the commodity. Examples of non-price competition include;
- Improvement and maintaining the quality of the products with the aim of promoting customer loyalty.
- Giving (distributing) free samples of the products to customers. This is mainly used when the product is new on the market for example soft drinks, telecommunication companies etc.
- Use of persuasive advertisement with catchy slogans for example breweries companies, soft drink companies, firms selling cosmetics etc.
- Carrying out promotional offers. For example selling the product at a lower price to customers through sales promotions, giving free training services to customers etc.
- Offering gifts and prizes. For example petrol stations giving soap and other detergents to their customers
- Sponsoring sports activities like volley ball, football, cricket etc. This is aimed at winning and selling the product to the consumers who are supporters of a given sports activity
- Supporting charity organizations by giving them household items like food, clothing, soap etc. For example child care centers, orphanage homes etc.
- Carrying out trade fairs and exhibitions. For example firms participating in the international trade fair at Uganda Manufacturers Association grounds in Lugogo to showcase their products.
- Providing after sales services. For example providing transport for those who buy in large quantities, free installation services, repairs etc.
- Organizing consumer games in form of raffle draws where a customer buys the product and enters a draw. The winners are given prizes for example cars, phones, domestic appliances etc.
- Opening up many branches and distribution centers in form of regional distributional centers and shopping outlets.
- Using one stop shopping centers where the customer can conveniently find all what he requires in one place. This is common in big shopping malls like Shoprite, Garden city. Mazima mall etc.
- Offering credit facilities to customers, for example allowing customers to acquire products on hire purchase, giving airtime on credit to their customers by telecommunication companies etc.
E-marketing of agricultural products
It is the application of marketing of goods and services through internet.
Advantages of e-marketing in agriculture
- Cheap
- Has a global reach
- Enable farmers/produces and customers to access information on commodities and prices
- Fast communication
- Easy access to information
Limitations of e-marketing in Uganda
- Computer illiteracy of farmers/producers and customers
- Remotes/lack of connection
- Lack of/unsteady electricity in rural areas to enable use of computers
- Language problems
- Technology dependence: E-marketing relies on technology and the internet, which can be disrupted.
- Worldwide competition: Launching products online exposes businesses to global competition.
- Privacy and security issues: Concerns about data privacy and security.
- Higher transparency and price competition: Online platforms make pricing and information more transparent.
- Maintenance cost: Managing and updating e-marketing resources can be expensive.
Efficiency of a farm
Farm efficiency is the ability to achieve maximum productivity with minimum wasted effort or expense
Farm efficiency lead less wastage, more income, better resource utilization.
Reasons why it is necessary to assess the efficiency of a farm from time to time
- To find out whether the farm is making profit or loss
- To determine growth
- To identify weakness in order to improve on efficiency
Measures to improve efficiency on farm
- Good management through proper decision making
- Selecting proper and marketability
- Application of fertilizers to increase plant yield.
- Planting early maturing crop varieties
- Irrigation to produce crops throughout the year
- Pest control to reduce farm losses
- Use of skilled labor to produce quality products
- Use of specialized extension service
- Fencing to ensure safety of the farm
- Proper record keeping to enable proper farming
- Proper feeding of farm animals.
- Proper housing of farm animals
- Timely weeding
- Proper spacing of crops
- Castration, dehorning, and debeaking to improve farm production
- Processing of farm product/value addition
Budgeting
A budget is an estimate of income and expenditure for a set period of time. A complete budget is a statement that describe and specifies income and expenditure of a firm for a given period of time.
Importance of budgeting on a farm
- To estimate required production resources in form of labor, capital and inputs.
- To estimate profitability of the farm enterprise.
- To attract funding from money lenders such as banks
- To direct or control expenditure in the business to enable high profitability.
- To provide basis of performance appraisal
- To exploit idle resources
- To set goals and provide direction to the managers of the farm.
Information required making a budget on a farm
- Scheduled expenditure
- Scheduled income
- Planned expansion
Steps followed when making a complete budget in agriculture
- State objectives
- List all available resources
- Estimate the size of land to estimate the number of livestock or planting materials required
- Estimate inputs and labor
- Work out estimates for the cost of inputs
- Estimate the value of expected revenue
- Estimate profit
Constraints in budget making in agriculture
- Lack of skill
- Illiteracy of among farmers in developing countries
- Lack of information on prices and sources of inputs
- Price instability
- Risks and uncertainties
- budget making is tedious
- limited funding sources
- Failure to follow the proposed budget
Depreciation
Depreciation is the fall in the price of a tangible asset which reduces the asset’s monetary value due to a variety of reasons like wear and tear that is caused by a prolonged use of the asset.
Record keeping on the farm
Farm record keeping involves documentation of vital activities that took place on the farm using record-keeping systems.
Importance of record keeping on a farm
- Tracking animal and worker healthy
- Ensuring tax compliance
- Tracking revenue and expenses
- Financial requirements for lenders, government agencies and insurance
- Farm planning and forecasting based on previous performance
- Enable improvements on the farming methods
- Help detect fraudulent practices on a farm
- To show economic status of a farm
Farm documents
- Documents on daily activities: records all things that happen on a farm on daily basis such as cash transactions, labor used, quantity of crops harvested and so on
- Order forms, invoices and Receipts show orders made, invoices and receipts received
- Cash book and payment receipt record book shows receipts issued from the farm
- Statement book contains a list of invoices indicating the things a farm has bought to enable payment at the end of the month.
- Inventory record which shows a list of items present on a farm at a particular time
- Yield and production record in which the various outputs of the farm are recorded
- Employment / worker recordsincluding general records, pay and hours worked, leave, superannuation and tax
- Safety reporting procedures – any incidents and injuries, including near misses. This will help you determine actions to improve and prevent reoccurrences.
- Hazardous chemicals on site and an asbestos register if there is any at your workplace.
- Registration documents for machinery.
- Testing, maintenanceand inspection details for specific types of equipment.
- Hazard identification, risk assessmentand control processes you have in place at your workplace. This is particularly useful in showing you are actively keeping your workplace safe by being proactive.
- Training and inductionsfor workers and contractors
Factors that determine the type of record to keep on the farm
- Nature of the farm i.e. livestock, poultry etc.
- Size of the farm
- Number of enterprises on the farm
- Skills and ability of the farm manager
- Number of activities on the farm e.g. irrigation, spraying etc.
Importance of warehouse receipts
- details quantity and quality of produce stored/received
- provide proof of ownership of the commodity stored
- In case of damage, the warehouse receipt may be used to claim for compensation to the producer.
Importance of inventory records of a farm
- used to calculate the value of farm assets or financial position of a farm
- Well-maintained inventory records can help farmers obtain bank loans. Lenders often require detailed information about a farm’s assets, including inventory, to assess creditworthiness.
- Provide the value of a farm in case of selling it.
- Useful for sharing the estate among beneficiaries in case of death of owner or dissolution of a cooperative.
A balance sheet
It is a financial statement that reports a company’s assets, liabilities and shareholder equity at a specific point in time.
Population economics
Population refers to the number of people living in a certain area (region) at a given time. The total number of people is established by carrying out population census.
- Population census refers to the physical counting of people in the country after a given period of time. In Uganda, population census is normally carried out after every 10 years.
Under population, optimum population and overpopulation
Under population
This refers to the population size where the increase in Labor force leads to an increase in output per capita given the available resources and capital stock.
Negative effects of under population
- It leads to underutilization of resources in the economy. The economic potential of the country is not properly tapped since some resources remain idle.
- It discourages specialization and division of Labor. There is a tendency of people to engage in subsistence production by producing a variety of traditional crops. This hinders economic growth and development.
- It discourages both local and foreign investors. This is due to the limited market size resulting from the small population.
- It leads to low per capita income. This leads to low standard of living of the people.
- It increases the unit costs of providing social services by the government. The expenditure on social capital per head is relatively high and not cost effective. It is not worthy to build roads, dams, schools, and hospitals for a small population.
- Under population hinders economic growth and development. This is due to lack of competition and initiative in the production process.
- It leads to shortage of Labor force. This forces the country to rely on foreign man power which is expensive.
- It makes it difficult to trade and exchange goods and services between regions. This is due to high transport costs as a result of the sparsely distributed population.
Optimum population
This refers to the size of the population which provides the Labor force that yields the highest possible output per capita given the available natural resources and capital stock. A country which experiences optimum population is one in which the existing technical knowledge, capital equipment and other natural resources are all used to yield the maximum possible output.
Over population
This refers to the population size where the increase in the Labor force leads to a decrease in output per capita given the available natural resources and capital stock.
Advantages of over population
- It increases the size of the domestic market for both the manufactured and agricultural products.
- It encourages Labor mobility. This is because many young people can easily move to other areas in search of employment.
- It stimulates rapid economic growth. This is due to the expansion of investments as a result of increase in market size. .
- It increases Labor supply and mobility in the country. This increases output hence economic
- The big population puts pressure on the government to provide social services so as to meet the basic needs of people.
- Stimulates investment
- increased exploitation and utilization of resources
- encourages innovations and inventions
Disadvantages of over population
- It leads to low standards of living. This is due to high cost of living and low per capita income.
- It leads to over straining of the available social amenities like water supply, medical services, electricity, roads etc.
- It leads to food shortage in the economy. This results in famine and malnutrition hence poor health conditions.
- It leads to excessive demand for goods and services in the economy hence demand pull inflation.
- It leads to balance of payment problems. This is due to increased importation of commodities in the country.
- It encourages rural urban migration with its associated problems. This is because people leave the rural areas to come and enjoy the better services in urban areas.
- It increases the levels of unemployment and under employment in the economy as a result of excess population.
- It leads to over exploitation of natural resources hence environmental degradation in form of pollution.
- It reduces government tax revenue in case the majority of the people are poor.
- It encourages political instabilities in form of civil wars due to the excessive pressure on the government for social
- It increases dependence burdens in the economy. This discourages savings and investments due to high consumption expenditure.
- leads to income inequality
- High social costs in form of pollution
- it results in brain drainage
- Limited domestic market due to low income
Measures to ensure food security in developing countries
- Intensive farming to produce food in small space
- Large scale farming to ensure large food production
- Mechanization of agricultural production
- Use of improved planting material and animals
- Use of improved production techniques such as use of fertilizers and pest control.
- Land reclamation to increase agricultural land
- Agro-processing to increase self-life of food and reduce wastage
- Importation of food to supplement local production
- Improved transport system to allow movement of food from where it is produced to where it is required.
The Malthusian population theory
This theory was put forward by a British economist in the 18th Century called Reverend Malthus. He used this theory to explain the relationship between population growth and economic development in form of food supply and other necessities. He observed that since land and other resources are fixed, any effort to increase food production would be frustrated by an increasing number of people due to the law of diminishing returns.
Rev. Malthus based his theory on the following assumptions.
- Population growth entirely depends on food supply.
- Population grows at a geometric rate doubling every after 30 years; for example 2, 4, 8, 16, 32 …
- Food supply grows at an arithmetic rate for example 2, 4, 6, 8, 10 …
Due to the differences in increase of population and food production; Malthus proposed, a given time T (the population trap) when the population growth would outstrip the means of subsistence (food supply) leading to starvation and death.
Illustration of the Malthusian Population Trap
Malthus suggested that the only way to avoid human suffering beyond the population trap; population growth must checked by preventive negative checks such as celibacy, late marriages, family planning, moral restrain, etc.
- Population Trap refers to the inevitable level of population at which population growth stops because of shortage of food to support it.
Limitations of Malthusian population theory
To a greater extent, the Malthusian population theory is of limited relevance or to developing countries in the following ways:
- He assumed that resources e.g. land are fixed and therefore food production cannot increase faster than population but ignored that the quality of resources can be improved.
- He ignored the fact that improvement in technology lead to increase in food production with use of agricultural mechanization and irrigation.
- The ignored the fact that continuous supply of food can obtained from international trade.
- He assumed that food is the only determinant of population growth; yet there are other factors such as immigration, levels of education, and cultural beliefs. The modern medicine and public health programs have reduced the death rate and therefore population increase does not show a define relationship with income per capita
- Foreign aid may not necessarily increase population in LDCs, because not all foreign aids are used in food production
- Malthus never indicated the time when the population trap would occur which means the theory is in waiting for the reality to occur.
- Malthus did not realize that rising living standards can cause a fall in birth rates and population growth. The theory assumes that national rates of population growth increase are positively related to the levels of national income. Therefore, as national income increases, population growth rates also increase yet in many countries as national income increases, birth rates have tended to fall.
- The theory was developed in Britain and has never been experimented in LDCs like Uganda and probably not substantial.
- The theory did not foresee great improvement in transport that makes it possible to transfer food from areas of plenty to areas of scarcity hence developing countries can offset the problems of food shortages.
- There is no mathematical relation as regards growth in food and population. There is no proof to show that population increases in a geometric progression and food production increase in an arithmetic progression.
- It ignored the possibility emigration to ease pressure on resources. People emigrate from countries which are densely populated to countries which are less populated resulting into reduced pressure on resources in the overpopulated countries.
- Failure of the theory to visualize (foresee) the possibility of Labor mobility from areas where opportunities are limited to areas where high wage employment opportunities exist.
- The theory is based on the subsistence economy yet modern economies of developing countries are not predominantly subsistence any longer. Commercialization of production leads to specialization and increased output for exchange thus averting any possibility of shortages in food supply. This too was not envisaged by the theory.
- The theory ignored the deliberate and scientific methods of birth control. Malthus did not foresee the possibility of applying modern family planning methods like use of condoms, vasectomy and contraceptive pills to reduce on population increase.
- Malthus was influenced by the law of diminishing returns which is not always true. At times increasing amount of a variable factor, Labor, to a fixed factor, land, results in increasing and constant returns not diminishing returns as the theory assumed.
Population problems in developing countries (Uganda)
- There is food shortage to support the increasing population. Countries are forced to import foodstuffs or to seek for foreign aid from other countries.
- Balance of payment problems. This is as a result of increased government expenditure on food imports and other social requirements for the population.
- High levels of unemployment and under-employment. The population growth rate exceeds the rate at which jobs are being created. This is due to limited job creating investments as a result of low savings and capital.
- Diminishing returns in the agriculture sector due to high population pressure on land and other natural resources. This leads to low levels of productivity and per capita income.
- Low capital accumulation. This is due to high consumption expenditures leaving little or nothing for savings and investment.
- Poor standards of living. This is due to shortage of goods and services and high levels of inflation due to excessive demand for goods and services.
- Over exploitation of natural resources hence environmental degradation and pollution.
- Rural urban migration leading to congestion, high crime rates, prostitution, theft etc. in urban centers.
- High dependence burdens. The increasing population makes developing countries to depend on other developed countries for foreign aid in form of food and other consumer goods.
- High levels of brain drain. The increasing population accelerates brain drain as the young and highly educated individuals leave their countries in search of “greener pastures” in developed countries.
- High levels of illiteracy due to low levels of education and poor health services. The majority of the people are poor and they cannot access the expensive higher education due to high dependence burdens.
- Political instabilities in form of civil wars and struggle for the limited social services.
Possible solutions to the population problems in developing countries
The solutions aimed at solving the problems of increasing population are contained in the population policy. Therefore the population policy is aimed at attaining optimum population by checking on population growth and increasing resources and production capacity. Such population policies include the following;
- Family planning. This includes the use of contraceptive pills, condoms and other intra-uterine devices. However, this method has not been effectively used due to high levels of illiteracy and fear of side effects.
- Encouraging higher education. Emphasis should be put on female education so as to check on the fertility rates and emphasize the quality of children other than the quantity. In addition, education also helps to postpone marriages for the future.
- Adopting production policies aimed at increasing food supply to reduce on food shortages. This helps to reduce on the diseases associated with malnutrition.
- Rural development policies aimed at making rural areas attractive so as to check on rural urban migration. Such policies include rural electrification, security, water supply etc. This also promotes agricultural production.
- Disease control measures. Health programs should be set up to educate the people on how to control and reduce on the spread of diseases through primary health care.
- Legalizing abortion as a way of controlling unwanted pregnancies and population growth.
Agricultural development
This a process of improving agricultural capacity characterized by sustainable, efficient utilization of factors of production.
The role of government in promoting agricultural development
- Liberalization of agriculture enabling private investors.
- Construction of dams and setting up irrigation schemes to enable cropping throughout the year.
- Provision of agricultural inputs such as fertilizers at subsidized prices.
- Development of improved planting materials.
- Provision of agricultural extension services.
- Provision of better tools equipment and cheap short and long-term credit.
- Encourage and assist farmers to form cooperative unions to source cheap inputs and market for the produce.
- Provision of water through valley dams and borehole to livestock in dry areas.
- Improvement of road network in rural area to enable marketing of produce and acquisition of inputs
- Construction of collection centres and modern storage facilities for produce.
- Promote agro-processing in order to add value to agricultural produce.
- Universal education to reduce illiteracy and ignorance
- Land reclamation to increase agricultural land
Agricultural extension services
Agricultural extension services are defined as “the entire set of organizations that facilitate and support people engaged in agricultural activities to solve problems and to obtain information, skills, and technologies to improve their livelihoods and well-being”
Importance of extension workers in rural agricultural development
- They train and educate farmers on modern farming practices to boost agricultural productivity.
- They encourage people in farming business to improve rural livelihoods
- They empower rural communities on their social economic and health aspects such as HIV prevention.
- They improve nutrition and household income through increased productivity and market oriented farming.
- Promote agricultural innovations
- Empower marginalized groups in agriculture.
Methods of value addition of agricultural produce
- Processing of produce to acceptable form
- Organic production, since consumers have high preference for organically produced products.
- Attractive packaging
- Blending with other substances to improve taste and flavor
- Transporting produce to the market
- Advertisement i.e. providing timely and persuasive information
- Early harvesting/planting
Gender analysis in agriculture
This is the systematic gathering and examination of information on gender differences and social relations in order to understand and redress inequalities based on gender.
Reasons for use of gender analysis in agriculture
- To remove constraints to participation of women and men in agriculture.
- To promote interests and needs of both women and men in agriculture
- To effectively control, monitor and evaluate development interactions.
- To ensure equitable and sustainable development of both men and women.
- To identify issues among a given group
- To ensure knew innovations, inventions and technologies will not adversely affect women.
Reasons for empowering women in agricultural production
- To increase the number of women involved in agricultures.
- To increase the work force in agriculture.
- To improve women social status in decision making
Factors that limit women’s participation in agriculture in Uganda
- Lack of land and other resource to carry out agriculture
- Lack security to obtaining credit
- Majority are illiterate with limited education
- Reproductive responsibility and children raising deny them enough time to engage in agriculture
- Lack of adequate time in agriculture due to their physiology such as pregnancy
- Inability to use big machines
- Poor /low income which makes it difficult for them to raise capital.
- Long distances to the market.
- Low access to information
- Introduction of modern crop hybrids that require additional labor.
- Low self-esteem of women in decision making
Ways of improving women participation in agriculture
- Encourage women to own land on which to grow crops even in absence of husbands.
- Promote positive self-esteem of women in decision making
- Increase women in agricultural education.
- Promote women in order to get credit.
- Build a positive attitude of women towards agriculture.
- Women should be encouraged to participate in extension workers’ meeting.
- Provision of social services in rural areas where most women reside.
Please find free downloadable notes, exams and marking guides of agriculture, biology, and chemistry from digitalteachers.co.ug website.
Dr. Bbosa Science
وضوح قيمة الإيجار الشهري وتاريخ الاستحقاق حيث حدد القانون الكويتي تاريخ 20 من كل شهر كموعد نهائي للسداد، وفي حال التأخر هذا التاريخ فإنه يحق المطالبة بإخلاء الشقة، مع إلزام المؤجر بسداد الايجار المتاخر عليه. برنامج تمويل السيارات صمم البرنامج لتلبية رغبة شريحة من العملاء في اختيار سيارة أحلامهم نفس خصائص الهواتف الذكية وسهولة التنقل بالنسبة لاستئجار سيارة شهرية، توفّر الشركات خدمات استلام وتوصيل مجانية في الإمارة المختارة. لذا إذا كنت تفكر بالبقاء في دبي لمدة شهر أو شهرين، فهذا هو الخيار الأنسب لك.
https://www.saprec.org/forum/welcome-to-the-forum/rkhs-shrk-yjr-syrt
We need to ensure that you’re a human تريب كوم هو تطبيق تأجير سيارات على مستوى العالم يمتاز بالمرونة المطلقة بما يتعلق بسياسة الإستئجار. وهذا أهم ما يمتاز به التطبيق عن غيره من التطبيقات المرفقة في هذا المقال. يتم الاستفادة من الخدمة عبر تحميل التطبيق الخاص بمشغلي الخدمة. هل تريد استئجار سيارة بدون دفعة تأمين؟ في كريم، أنت بالمكان الصحيح. نحن نوفر تجربة استئجار سهلة وخالية من أي تعقيدات: Should you have any inquiries, please feel free to reach out to our manager via chat or call us at +971544402848
When developing a strategy for horse race betting, it is important to keep in mind your own personal style. No one strategy will be best for all horse race bettors. So, the first thing is to know your strengths. Demand value if you can: In pari-mutuel horse race wagering, you are betting against other bettors, not the house. More often than not, the public is wrong. Assess what you believe a horse’s true odds should be, and if the actual odds are higher, consider making a wager. Conversely, if you believe a horse is overbet, consider looking elsewhere. Fixed odds bettors don’t have to deal with wild fluctuation like pari-mutuel pools do when money floods in on a horse. Fixed odds bettors can also easily exploit long initial odds at the time they placed the wager, meaning if a horse at a long price is bet down to the favorite, they still will be paid the long odds.
https://ejjii.com/list.php?part=2024/06/13/28
Setting out on the exciting enterprise of the 1xBet Toto 15 Jackpot is like venturing into a world where technique, good fortune, and sports information collide to offer an extraordinarily energizing encounter. This isn’t fair to any standard wagering amusement; it’s a journey for radiance, a test of foreknowledge, and a chance to connect the positions of those who’ve turned forecasts into considerable rewards. In this direct, we’re jumping profoundly into the heart of the 1xBet Toto 15, exploring the subtleties of its rules, the fervor of making forecasts, and the procedures that seem to raise your amusement from confident speculating to educated determination. To play, simply predict the outcomes of the 12 specified events and submit your free prediction. On the bet slip, select “1” for a Home Win, “2” for an Away Win, or “X” for a Draw. Only one outcome is allowed per event. Predictions must be submitted before the first TOTO match starts, as bet slips submitted after this point will be invalid.
What`s the count of new casinos that began operation in 2024? There isn`t a specific number, as this is an ongoing process. One thing is for sure – there is a certain appeal to those gambling venues for many Aussie gamblers. When playing at the newest casino, you will almost certainly be treated to a shockingly high bonus offer and otherbenefits. Competition in this industry is high, so playing the field before you settle for a certain newest online casino makes sense. Super Slots stands out as the top real money online casino for crypto users. Many real money online casinos in Australia offer cashback bonuses, allowing you to claim a portion of your losses back as bonus funds or real money. Local operators could not offer real money casino services to citizens but offshore operators still had the privilege of providing casino games to players since the restriction was meant for just local operators. This gave gaming authorities like UK gambling commission and Malta authorities a wider and bigger market to explore with both commissions becoming the most dominant in the country due to the remarkable casinos they have under their licence.
http://www.popsotong.com/gb/bbs/board.php?bo_table=free&wr_id=29430
Playing an online casino for real money requires a licensed casino site. No online casino where you can win real money can operate without a licence from an official gambling commission. There are multiple options for gamblers to play real money casino games online at many instant withdrawal online casino USA sites. There are established names among best gambling sites like the Borgata, Caesars, Golden Nugget, DraftKings and many others with fast payouts. More states are opening up sports betting and gambling; regulated, legal casino business online is expanding and number of free credit caasinos is rising. You can play for free without staking your own money with no deposit bonus casino offers and win and withdraw real money prizes. You can email the site owner to let them know you were blocked. Please include what you were doing when this page came up and the Cloudflare Ray ID found at the bottom of this page.
Масла для волос с аргановым маслом (33) Для жестких и кудрявых. Для большего блеска и меньшей пушистости таких волос применяют оливковое масло. Его следует распределить по полностью высушенным волосам и оставить на локонах от двух до десяти часов. Однако будьте аккуратны и не перегните палку с количеством косметического средства. Наносите масло экономно и осторожно с помощью ватной палочки или чистой кисти, чтобы оно не попало в глаза. Использовать его нужно на ночь перед сном и после пробуждения смыть чистой водой. Также можно смешать две чайные ложки касторового масла с двумя чайными ложками геля алоэ вера. Для достижения наилучшего эффекта повторяйте процесс регулярно в течение одного-трех месяцев. Народные знахари в своих копилках имеют огромнейшее количество средств и методов для ухода за бровями, а также ресницами. Если с волосками наблюдаются какие-либо проблемы, то эффективно устранить их помогут маски, приготовленные на основе эфирных масел.
https://wiki-room.win/index.php?title=Средства_для_роста_ресниц
Long4Lashes – это сыворотка, ускоряющая рост ресниц. С ней ваш взгляд скажет больше! Сыворотка стимулирует рост ресничек, удлиняет, укрепляет, увеличивает объём, а также улучшает их форму Препарат также обогащен гиалуроновой кислотой, которая увлажняет и разглаживает ресницы, а также провитамином В5, который, проникая в волокна волосков, улучшает их структуру и делает их более крепкими, эластичными и блестящими. Аллантоин уменьшает раздражения и покраснения.
EyesBlue Current slide of – Save on Eyeliner Home > Products > Smashbox Always Sharp Waterproof Kohl Liner HIGH-IMPACT COLORHyper-pigmented kohl for color-rich results Always the bestRun, dont walkBeen using for years from SephoraBest price in town This is the perfect shade of warm deep dark brown as an alternative to black. It self-sets but you do have some play time to smudge it if you want, and once it sets it stays put. Super easy to use because of the self sharpening cap. Only issue is it can run out suddenly without warning since you can’t tell how much product is left. Love all the colors actually! Remind me about upcoming Smashbox shows. Created at Smashbox Photo Studios L.A. I have been on a search for an eyeliner that has true wearing power, a liner that is highly pigmented and a liner that caters for sensitive eyes. I found that special liner when I purchased this amazing Smashbox winner. Yes, this liner really does deliver spectacular results and the fact that it comes with a built in sharpener is a bonus! Cleopatra eyes guaranteed with this!!!
https://conselhos.teresopolis.rj.gov.br/eu/user/quechantbehor1987
Washable Mascara Maybelline Tattoo Brow: a DIY brow tint that allows you to temporarily “tattoo” your brows at home. So what is the verdict? Well, yes it will tint your brows and is more cost effective then going to a salon to get them tinted. Yes, it tints skin and hairs. But it is a proper fiddle and a faff to do. If you are going to use Maybelline Tattoo brow gel then recommend putting it on before bed and sleeping in it for the best outcome. Then you don’t have to worry about not going out in the day as you have black slugs setting on your forehead. You ca wake up, peel it off, and be ready for the next 3 days. HairOther This content can also be viewed on the site it originates from. Designed for thick application, use the brush to carefully paint the peel-off eyebrow tint on in your desired shape. Be sure to cover all areas evenly, and for a truly natural look, fade out the coverage with a spoolie brush at the front of your brows. Simply tidy up any mistakes using a cotton bud to smooth the tint away.
Thanks again for the blog. Great.
I need to to thank you for this excellent read!! I definitely enjoyed every little bit of it. I have you book-marked to check out new stuff you postÖ
Look advanced to far added agreeable from you!
I really liked your article.Thanks Again. Great.
Very informative blog post.Much thanks again. Really Cool.
Fantastic job on this article. Keep it up! Sports Fitness & Outdoor
This is one awesome blog post.Really thank you! Great.
Major thanks for the blog post.Thanks Again. Fantastic.
Muchos Gracias for your article.Much thanks again. Fantastic.
Really appreciate you sharing this article post.Really looking forward to read more. Awesome.
I’m always amazed by your depth of knowledge. Tech News
Greetings! Very helpful advice in this particular article!It’s the little changes that will make the most significant changes.Many thanks for sharing!
online slots slots games free play slots online
Accelerate your medical career with MBBS Direct Admission in Orissa.
Secure your medical career with MBBS Direct Admission in Uttar Pradesh.
Major thanks for the article post.Really thank you! Fantastic.
Sign up using the Raja Luck Invite Code for an exciting start.
Fantastic blog article.Much thanks again. Much obliged.
Very informative post.Thanks Again. Great.
erectile dysfunction natural treatment – erectile dysfunction medications free samples of ed pills
Cuando decides comprar seguidores en Instagram, estás tomando la iniciativa de aumentar tus posibilidades de atraer a nuevos seguidores y elevar tu popularidad en la plataforma. ¿Por qué es esto importante? Porque la cantidad de seguidores que tienes en Instagram juega un papel fundamental a la hora de captar la atención de otros usuarios. Cuando alguien ve que tienes un gran número de seguidores, es más probable que se sienta atraído por tu perfil y decida seguirte también. Como puedes ver, en Instagram también hay algunos trucos para conseguir más seguidores. Estos son algunos de los más sencillos y legales. Si quieres tomar más riesgo, puedes buscar técnicas más black hat para aumentar los seguidores, aunque nosotros no te lo recomendamos. Lo mejor es que tus seguidores sean de la mayor calidad posible, y con estos consejos, los conseguirás.
https://www.mapleprimes.com/users/tiovinrokee1976
Las redes sociales experts del equipo Plixi le echarán una mano para llegar a su público objetivo. Deberías esperar una avalancha de nuevos seguidores y likes en tu página Instagram . Una aplicación Instagram likes puede complementar estos resultados, no ser la fuente principal de ellos. Gracias a nuestro algoritmo propio de segmentación por IA y a nuestra plataforma interna de personas influyentes Instagram , podemos proporcionártelo. Cree una comunidad Instagram que encaje con su marca. Plixi puede ayudarle a empezar a aumentar sus seguidores en Instagram . Comenzar ¡hoy mismo! Followers.io te permite comprar seguidores, me gusta y vistas de Instagram. Puede obtener 50 Me gusta por solo $ 1.37, lo que convierte a Followers.io en un servicio asequible para pequeñas marcas e personas influyentes. Con Followers.io, puede obtener hasta 40,000 Me gusta de Instagram a la vez.
Burada güzel, çıtır ve içten bir sür gecelikescort bayan var.Yapman gereken bu kadınları anlamak için sohbete de önem vermek.
QeM is developing a new method to operate a Blockchain Wallet that benefits from the protection provided by the QeM Quantum Random Number Generator (QRNG2). As first reported by the MIT Technology Review, the researchers investigated quantum computers’ application against both mining pools and using the machines to attacks private keys. Miners will be safe for longer than wallets, the researchers contend. Sign in You can also contact us to find out how we can assist you with leveraging Flow infrastructure, marketing support, and potential funding. We have these two other questions that touch on the same subject of how safe is Bitcoin from quantum computing attacks, but I believe mine is specific enough to be a separate question: Given this potential leap in processing power, many have theorized that quantum computers would render current encryption technology useless. That includes the SHA-256 algorithm, an algorithm that encrypts private key information when two bitcoin wallets transact with each other. Thus, there is a narrative that has spread over the years that quantum computing will eventually break bitcoin.
https://gettogether.community/profile/276535/
The Bitgert coin is already on its way to making millionaires out of early investors. Investing as little as $100 could turn you into a millionaire with bitgert. All it takes is to get in on Bitgert early while the supply is still very high. BRISE is the native token of the Bitgert Brise Chain. It was initially launched as a BEP-20 token on the BNB Beacon Chain before transitioning to the native token of the Bitgert Chain mainnet. It is used to pay transaction fees and can also be staked within the blockchain to improve the network’s resilience and security via validators. Amidst the ocean of very dynamic cryptocurrency projects and innovations, Bitgert is a project with very evident growth and potential. It is exploding onto the scene as a favorite with the highest and cutting-edge solutions. Now, let’s look at what makes Bitgert stand out.
Say, you got a nice blog. Want more.
Muchos Gracias for your blog article.Much thanks again. Really Great.
wow, awesome article post.Really thank you!
Really informative article post.Much thanks again.
Im grateful for the blog article. Great.
Fantastic article post. Want more.
When someone writes an paragraph he/she maintains the idea of a user in his/her mind that how a user can understand it.So that’s why this article is outstdanding. Thanks!
2one5 apartments millwood apartments apartments for rent lawrence ks
Im obliged for the blog.Really thank you! Much obliged.
Fantastic blog post.Really thank you! Much obliged.
I appreciate you sharing this article post.Thanks Again. Will read on…
I value the article post.Much thanks again. Much obliged.
desembolso de correo a asociado e invitado instancia y consejos
wow, awesome article.Really looking forward to read more. Will read on…
Great, thanks for sharing this blog post. Really Cool.
I appreciate you sharing this blog article.Really looking forward to read more. Want more.
Thanks so much for the blog.Really looking forward to read more. Keep writing.
Im grateful for the blog article.Much thanks again. Want more.
PRODUCTS AND SERVICES Crash slot Aviator is usually an online gambling sport where players gamble on a expanding multiplier. The fact of the slot is usually to take your current winnings over time before the multiplier collapses. The longer waiting, the higher the particular winnings, but also the risk improves. These features, in conjunction with a simple but thrilling gameplay mechanic, have cemented Aviator’s position as a new favourite among accident games worldwide. For a detailed malfunction, check out the Aviator game of india review, which highlights its gameplay in addition to strategies. You can email the site owner to let them know you were blocked. Please include what you were doing when this page came up and the Cloudflare Ray ID found at the bottom of this page. In addition, Aviator game offers a 97% Return to Player (RTP), which means it can be one of the most lucrative games you can play online.
https://paper.wf/rerofecro1976/if-you-want-to-download-aviator-on-pc-you-can-only-do-it-with-an-android
The Aviator demo game is a risk-free feature within the game, allowing players to experience and practice the game without using real money. It provides virtual credits for betting, making it an ideal platform for learning and testing strategies before playing with actual funds. Supported Devices and System Requirements Android OS is widely used, offering flexibility and accessibility to players. The Aviator game APK file is optimized for smooth performance on most Android devices. Its user-friendly design ensures quick installation and enjoyable gameplay. Regular updates enhance functionality and address technical issues. The simplicity of Aviator is part of its appeal. Players place their bets before the plane takes off and then watch as the multiplier climbs. The longer the plane stays in the air, the higher the multiplier rises, increasing the potential payout. However, the plane can disappear at any moment, and if you haven’t cashed out before it does, you lose your bet. This creates a thrilling sense of risk and reward, requiring players to balance greed with caution. Compared to more complex casino games with multiple rules and strategies, Aviator is easy to understand and play, making it accessible to a wide range of players.
I appreciate you sharing this article.Really thank you! Great.
Looking forward to reading more. Great blog article.Really looking forward to read more. Much obliged.