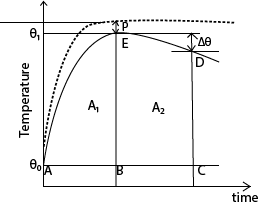
Explain clearly the steps taken to determine the cooling correction when measuring the specific heat capacity of a poor conductor by the method of mixtures.

Explain clearly the steps taken to determine the cooling correction when measuring the specific heat capacity of a poor conductor by the method of mixtures.
- Pour a liquid in a calorimeter and place it on a table
- Place a thermometer into the liquid and after sometime, record the temperature of the surroundings, θ0.
- Gently place a hot solid into the liquid and stir.
- Record the temperature of the mixture at suitable interval until the temperature of the mixture has fallen by about 10C below the observed maximum temperature, θ1.
- Plot a graph of temperature against time

- The broken line shows how we would expect the temperature to rise if no heat were lost and the difference, P, between the plateau of this imaginary curve, and the crest of the experimental curve, E. is known as the ‘cooling correction’
- Draw a line AC through θ0 parallel to the time axis.
- Draw a line BE through θ1 parallel to the temperature axis.
- Draw a line CD beyond BE parallel to the temperature axis and note Δθ
- Estimate the area A1 and A2 under the graph by counting the square on the graph paper
- Cooling correction, P s given by the graph
![]()
Please Subscribe to promote this website. Subscription is free
Share with a friend
Your comment is valuable
Thank you so much
CATEGORIES heat A-level
TAGS Dr. Bbosa Science

Thanks
This is so interesting, thanks for posting! Electronics
This is the kind of content I love to read. Barcelona News
Explore cost-effective medical education options with the MBBS Fees Structure in Telangana.
Learn about advanced healthcare education at Top MBBS Colleges in Kerala.
Challenge yourself and win amazing prizes with the Raja Luck Game.
Your plot of the cooling curve has been so organized and clear to me thus easy to understand, thanks alot papa.
Get an expert overview of Raja Luck and its importance.
Track IPL 2025 team performances, game-changing moments, and player statistics in IPL 2025.
Get access to high-end computing with scalable Server Rental in Bengaluru for your IT needs.