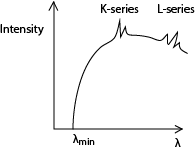
Explain, using suitable sketch graph, how X-ray spectrum in an X-ray tube are formed.

Explain, using suitable sketch graph, how X-ray spectrum in an X-ray tube are formed.

The spectrum consists of two major components, i.e. the continuous (background) spectrum and the very sharp line spectrum superimposed onto the background spectrum.
The continuous spectrum is produced when electrons make multiple collisions with the target atoms in which they are decelerated. At each deceleration, X-rays of differing wavelength are produced.
The shortest Wavelength X-rays are produced when electrons lose all their energy as X-ray photon in a single encounter with the target atoms. The wavelength of the X-rays at this point is known as the cut off wavelength. At cut off wavelength, energy in an X-ray photon equals kinetic energy of the electron;
The line spectrum
At high tube voltages, the bombarding electrons penetrate deep into the target atoms and knock out electrons from inner shell. The knocked out electrons occupy vacant spaces in higher unfilled shells putting the atom in excited state and making them unstable.
Transition of an electron from higher to lower energy levels results in an emission of X-ray photon of energy equal to energy difference between the energy levels.
If the transition ends in the K-shell, it produces K-series and if the transition ends in L-shell. It produces L-series.
Please Subscribe to promote this website. Subscription is free
Share with a friend
Your comment is valuable
Thank you so much

I’m always impressed by your depth of knowledge. Home Improvement
This is spot on. Keep up the good work! Transfer Latest
Explore the competitive MBBS Cutoff Of Government Medical Colleges in Uttar Pradesh for better planning.
Learn about cutoff scores for admissions at MBBS Cutoff Of Government Medical Colleges in Kerala.
Enjoy exclusive benefits by applying the Raja Luck Invite Code.
Gain early access to brand-new games and promotions with the 82 Lottery Invite Code.
Find out How to get backlinks and dominate online search engine rankings with top quality links.
Unlock special rewards by utilizing the Diu Win Invite Code when registering.
Enjoy trustworthy and scalable computing with premium Server Rental in Gurgaon.
Delight in an immersive and rewarding gaming journey with bdg-win.
Join millions of gamers worldwide on 55-club and experience the adventure of winning.
Get the best online video gaming experience with bdg win for exciting rewards and benefits.
Get sincere insights with Household Product Reviews to find the best home basics.
I extremely advise Onlymp3 Downloader for its speed, ease of use, and unlimited complimentary downloads.
I enjoy how in-depth this guide is! When I visited, Escort Service In Nainital assisted make my solo journey more enjoyable with excellent friendship.
Finding Authentic Taste is rare, but this place has it.