
With the aid of a sketch graph, explain the hysteresis curve for ferromagnetic material

With the aid of a sketch graph, explain the hysteresis curve for ferromagnetic material
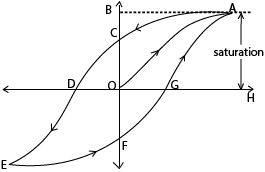
- When a magnetic field is applied to a ferromagnetic material, the magnetic domains tend to align with the applied field. The magnetic flux density increases along OA until saturation. When the magnetizing field is reduced to zero, there is residue magnetization at C. This is due to failure of the dipoles to respond instantly. Energy is lost.
- To bring the dipoles to their original orientation, a magnetic field OD is applied in opposite direction. As the magnetic field is increased in this reversed direction, saturation is attained at E
- When reversed magnetic field is reduced to zero, state F is attained. Reversal of dipoles requires an increase of magnetic field in opposite direction to state EF. The cycle is then repeated on further increase of magnetic field
- The curve of B verses H is called a hysteresis curve
Please Subscribe to promote this website. Subscription is free
Share with a friend
Your comment is valuable
Thank you so much
CATEGORIES A- Magnetism
TAGS Dr. Bbosa Science