 paper 2 section A revision questions")
Geography (UACE 250/2) paper 2 section A revision questions

- Study the table below showing the area under forest in selected countries in Africa (2010) and answer the questions that follow
| Country | Total forested area (km2) | Total land area (km2) |
| Algeria
Nigeria Morocco Mali Cote d’Ivoire Niger |
14,920
90,410 51,319 124,900 104,030 12,040 |
2,381,741
923,768 446,550 1,240,000 322,463 1,267,000 |
Adapted: 2010 World Development Indicators, World Bank, Washington D.C. pp1-9
Viacmillan Uganda Secondary School Atlas Pp 114
Using the baseline map provided
(a) Draw super-imposed proportional squares to represent the information in the table above (12marks)
(b) Outline the advantages and disadvantages of using the statistical method in (a) above (05marks)
(c) Describe the conditions which have favored the development of the forestry industry in either Algeria or Cote d’Ivoire.

Possible answers
(a) Draw super-imposed proportional squares to represent the information in the table above (12marks)
The candidates are expected to draw super imposed proportional squareson the basemap provided to show total forested area (km2) vis-à-vis total land area(km2) for each of theselected country in Africa.
Procedure
Find the length of reprensention squares of total land and total forested area of each country by finding the squared root of the respective area divided by the scale


(b) Advantages of the method
- Is easy to interpret
- It is used for comparison
- It has good visual impression
- It can be imposed on maps
- It shows variety of information
- It is easy to draw.
Disadvantages include
- Itinvolves tedious calculations
- It does not show absolute values
- Appears conjested
- Time consuming
- The conditions for growth of forestry industry are more or ess similar in both countriries
Cote d’Ivoire
- Equatorial climate characterized by hot temperature of about240C and wet conditions i.e. heavy and well distributed rainfall of over 1500mm favor growth of forests
- Fairly fertile soils that favor the quick growth of forests especially in the southern region and around Gagnoa and Divo.
- Fairly low altitudein much of the country that rarely exceeds 200m above sea level favors growth of big trees such as Ebony, mahogany etc.
- The mountainous nature in some areas limits settlement so favors the growth of forests. For example the Toura mountains in the west of Ivory coast.
- Existence of numerous rivers for floating and transporting logs. E.g. R. Sassandra, R. Cavafia, R. Komoe and R. Bandama.
- Developed coastal ports such as Sassandra, San Pedro and Abidjan handle forestry exports such as timber.
- Existence of a variety of commercial tree species such as Mahogany, Ebony, Iroko, Idigbo that command high prices on the world market.
- Existence of capital to inject in the forestry industry. Such capital come from the state and foreign French companies.
- There is relatively a big local market for forestry products and ready market form France, Malaysia, India and Japan.
- Modern technology in form of tractors, diesel saws and chainsawa are used to exploit the forest cheaply and efficiently.
- Presence of both skilled and semi-skilled labour. Skilled labour is provided by the French, malaysian and Chinese workers whille the semi-skilled labour is provided by the locals that do manual work like chopping of leaves and transportation of logs.
- Relative political stability favoring foreign investment in forest industries
- Supportive government policy e.g. afforestation and re-afforestation in south-west.
- Presence of developed roads and railways for cheap transport of forest products
- Presence of vast land where forests grow
- Intensive research to develop industry by the cote d’Ivoire forestry Authority
- Presence of cheap energy generated by R. Bandama and Sassandra for processing of products from trees.
- Study the table below showing Nigeria’s population structure and answer the questions that follow;
Table showing Nigeria’s population in millions (2012)
| Age group | Males | Females |
| 80+ | 0.5 | 0.5 |
| 70 – 79 | 1.2 | 1.3 |
| 60 – 69 | 2.6 | 2.6 |
| 50 – 59 | 2.3 | 4.0 |
| 40 – 49 | 6.6 | 6.8 |
| 30 – 39 | 10.3 | 10.1 |
| 20 – 29 | 14.6 | 13.9 |
| 10 – 19 | 19.5 | 18.6 |
| 0 – 9 | 27.6 | 26.1 |
Adapted: Index Mundi, com/nigeria. age-structure.htm CIA World Bank Factbook, as of February 21, 2013
(a) Draw a population pyramid to represent the information given in the table (10 marks)
(The candidates are expected to draw population pyramid to represent population (2012) in millions)

(b) Outline the merits of using the statistical method in (a) above (03marks)
- It has good visual impression
- It is easy to interpret
- It used for comparision purpose
- It is easy to draw
- It doesn’t involve calculation
- It can be superimposed
- It shows varying information (versatile)
(c) Describe the structure of Nigeria’s population in 2012 (04marks)
- It has a wider base/it has a large population of young people
- It has a narrow top/it has a small aged population
- Age groups 0 – 39 years has more males than females in Nigeria’s population
- Age groups (50- 59) and (0 – 79) has more females than males
- Age groups (50 – 69) and 80+ have the same number of males and females
- It has few old dependents
- It exhibits low life expectancy
(d) Explain the implication of such a population structure on the development of Nigeria. (08marks)
Positive implication
- Provision of labour
- Provision of market
- Provision of security
- Provision of revenue
- The young popuation encourages creativity and innovation
- Enhance provision of social services
- Encourages utilization of resources
- Leads to development of urban centres.
Negative implication
- High dependence ratio
- Strain social services
- Food shortage/hunger
- Inadequate accommodation
- Unemployment
- Increased crime rate
- Shortage of land/land fragmentation
- Over utilization of resources/encroachment on environment
- Pollution
- Increased rural urban migration
- Brain drainage
- Over crowding
- Easy spread of diseases
- Insecurity/unrest
- Immorality/juvenile delinquency
- Cultural erosion
- High expenditure on social services.
- Study the table below showing the farmers’ calendar in Kikuyu-land, east Africa and answer the questions that follow:
| Months | Rainfall (mm) | Planting | Harvesting | othera |
| J | 38 | Bean
Sweet potatoes coffee |
Land preparation | |
| F | 64 | |||
| M | 125 | Maize
Pigeon peas Beans Sweet potatoes |
||
| A | 211 | |||
| M | 158 | Weeding
Peas potatoes |
||
| J | 46 | Beans | ||
| J | 15 | Maize
Sweet potatoes |
||
| A | 25 | |||
| S | 31 | |||
| O | 53 | |||
| N | 109 | Beans
Sweet potatoes |
||
| D | 86 |
Adapted. Hickman G. at al (1995) Lands and peoples of East Africa: Longman P 72
(a) Draw a circular graph to represent the information in the table above (10marks)

Or

(b) Outline
(i) Merits (02marks)
- It is easy to draw
- It is easy to interpret
- It has good impression
- It shows a variety of information
- It is used for comparison purpose
- It can be superimposed
- Cyclic nature portray continuity
- It requires no calculations
(ii) Demerits of using the statistical method in (a) above(02marks)
- It tedious
- It appears congested
- Occupies a big space
- Cyclic bars are not easy to draw
- Wide amplitude makes it difficult to derive the scale
(c) Explain the relationship between rainfall and farming activities in Kikuyu-land (08marks)
- During the dry season/low rainfall period, harvesting of beans, sweet potatoes and coffee take place.
- The dry season/low rainfall period is used for planting of maize, pigeon peas, beans and sweet potatoes
- The wet season/rainy season influence the weeding activity
- The wet/rainy season is for planting of Beans and sweet potatoes
(d) Suggest measure that should be taken to improve farming activities in Kikuyu land (03marks)
Measures suggested as to improve farming activities in Kikuyu-land are
- To use sprying methods
- Use irrigation methods to boost farming
- To research and get resistant and high yield crops
- Obtaining agricultural loans to expand their farms
- Imparting new agrictural skills to their labourers
- Crop rotation to conserve their soils
- Improve transport and communication in order to reach their market easily and cheaply
- To carry out market research for their produce.
- Use improved technology
- Setting up co-operatives to buy and market produce
- Carry out land reforms.
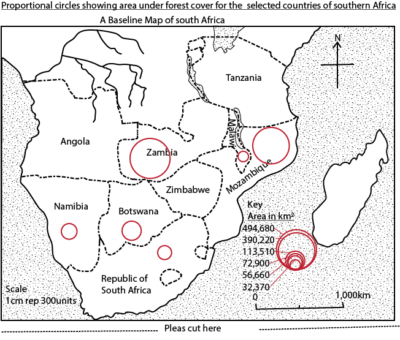
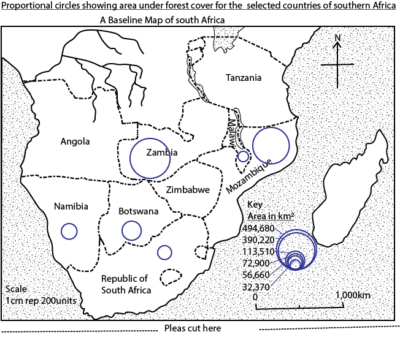
- Study the table below showing area under forest cover for selected countries in south Africa (2010) and answer the questions that folow
| Country | Forested area (km2) |
| Botswana
Malawi Mozambique Namibia South Africa Zambia |
113,510
32,370 390,220 72,900 56,660 494,680 |
Adapted:2010 World Development Indicators, world Bank, Washington D.C Pp1-9; Macmillan Uganda Secondary school Atlas Pp 114
(a) Using the baseline map of south Africa provided, draw proportional circles to represent the information in the table above (10 marks)
(b) Outline the merits and demerits of using the above method (07marks)
(c) Account for the development of the forestry industry in any one country given in the table . (08marks)

Solution
(a) Candidates are expected to calculate the radius using a common scale so as to draw proportional circles on the baseline map of south Africa.
Note we consider two approaches for finding the radius
![]()
When the values of the radius obtained are too big to fit on the paper, appropriate scale is used.

Note: Assumed scale- 1cm represent 300units


(b) (i) Merits of the method
- It is easy to draw
- It is for comparison purpose
- It is easy to interpret
- Used to show variety of information
- It has good visual impression
- Superimposing is possible
(ii) Demerits of the method
- It involves lengthy calculation
- It appears congested
- It is tedious
- May not show absolute figures
- It consume space
- Difficult to find suitable scale
(c) The candidate must state one country from the table and account for the development of the forestry industry. NB. The factors are more or less similar. These include among others:
- Favorable climate conditions
- Altitude
- Drainage/water supply
- Fertile soils
- Presence of vast land for growth of forests
- Presence of commercial tree species
- Presence of labour
- High level of technology
- Research
- Availabiity of adequate capital
- Presence of transport means
- Availability of market
- Presence of power
- Political stability
- Favorable government policy.
These outlined poits need explanation in order to earn marks.
- Study the table showing rooad and railway transport in selelcted African countries (2000-2005) and answer the qustions that follow
| Country | Road network (km) | Railway network |
| Nigeria | 193,200 | 3,528 |
| Botswana | 24,455 | 888 |
| Cote d’Ivoire | 80,000 | 639 |
| Dr Congo | 153,497 | 3,641 |
| Ghana | 47,787 | 977 |
| Zambia | 91,440 | 1,273 |
| Total | 590,379 | 10,946 |
Adapted: 200 World Development Indicators: World Bank, African Database p 72
(a) Draw combined proportional divided semi-circle to represent the information given in the table (12marks)
(b) Outline the demerits of using the statistical method in (a) above (05marks)
(c) Identify the country with the longest:
(i) Road network (01mark)
(ii) Railway network (01mark)
(d) Account for the development of the transport sector in any one country identified in (c) above.
Solution
The radius of each of the semi-circles is obtained by calculating the square root of the total road and railway distances.


Or
Road network πr2 = 590379 railway network πr2 = 10,946
Area = total distance 3.14r2 = 590379 Area = total distance 3.16r2 = 10,946


(b) Demerits
- Requires tedious calculations
- Drawing consumes time
- It does not show absolute values
- It is difficult to represent small angles
- Not easy to read angles without measurement
- Many variable/items make it congested
- Occupies a large space
(c) country with the longest
(i) road network is Nigeria
(ii) railway network: DRC
(d) Factors for the development of the transport sector in either Nigeria or DRC
They are more or less similar for both countries
- Presence of abundant mineral resources for example gold, tin in Katanga and Kisangani provinces, others are copper, diamond in Kasai region and iron ore that necessitated construction of railway line in the eastern and northern part of DRC.
- Existence of extensive forest resources favored development of the railway transport in order to exploit forest products such as timber
- Presence of rich agricultural inter land with a variety of commodities to be transported along railway line. These included food stuffs like bananas, coffee, bean, livestock, maize, sugar canes etc.
- The gently sloping landscape in the north in Kisangani province and in the eastern Katanga province mat it easy to lay or construct the railway line for use in transportation of people, merchandise and mineral like gold.
- Availability of capital use for railway construction.
- Presence of skilled (from France, Belgium and china), semi-skilled and unskilled labour.
- Presence of improved technology such as use of tractor in clearing land where the lines would pass, use of diesel saws to cut trees, use of crane to lay the railways.
- Large population in interior to provide market for the railway service.
- Favorable government policies for the construction of transport system
- Political stability that allowed for construction of railway lines
- Study the table provided below showing land area and population size for selected African countries and answer the questions that follow
| Country | Land Area (‘000s km2) | Population size (‘000s) |
| Algeria
Central African Republic Chad Djibouni Egypt Ethiopia Libya Morocco Niger Somalia Sudan Tunisia |
2,382
623 1,259 23 995 1,000 1,760 446 1,267 627 2,376 155 |
30,800
3,800 7,900 600 65,200 65,800 5,400 29,200 11,200 9,100 31,700 9,700 |
Adapted: 2003 African Development Indicator; World Bank, Washington D.C p5
(a) Calculate the population density for each of the selected countries shown in the table (06marks)
(b) Using the base map provided below, draw a choropleth (density) map to represent the information obtained in (a) above(10 marks)
(c) Outline the demerits of the statistical method used in (b) above (03marks)
(d) Explain the causes of the variation in the population density of the region shown on the base map (06 marks)

solution

(b)

(c) The demerits/disadvantages of the method used are
- Shading consumes time
- It assumes that the population is uniformly distributed throughout in the area and throughout the year.
- The assumes that the population density changes abruptly across the boundaries
- Many grades makes it congested
- Doesn’t give actual population figures
- Involves tedious calculations
- Consumes a lot of space
(d) Causes of population variations
- Historical factors for instance depopulation through slavery
- Climatic factors such as heavy rainfall lead to dense population
- Fertie soils lead to heavy population
- Presence vectors/diseases such as tsetse fly lead to low population.
- Presence of minerals that attracts people
- Wild animals may scare away people
- Political atmosphere such as wars in angola lead to sparce population
- Well drained areas attract people while swampy/water ogged areas lead scarce population
- Urbanization such as towns like Pretoria have more settlement
- Relief: gentle slopes usually are densely populated compared steep slopes and deep valleys
- Transport and communication/social services attract big population
- Government policy of directing population through settlement schemes.
- Candidates should explain the above outlined points with reference to specific examples
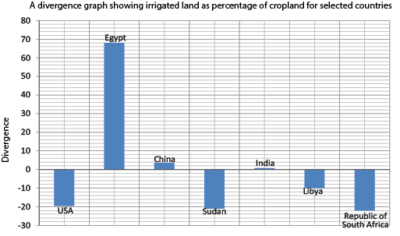
- Study the table below showing land under irrigation for selected countries and answer the questions that follow
| Country | Irrigated land percentage of cropland |
| USA
Egypt China Sudan India Libya Republic of South Africa |
12.5
100 35.5 10.9 32.7 21.9 9.5 |
Adapted from 2008: World Development Indicators. The World Bank, Washington D.C Pp 134-136
(a) Draw a divergent bar graph to represent the information given in the table (12marks)
(b) State the disadvantages of using the statistical method in (a) above (03marks)
(c) Explain the conditions which favored irrigation in either USA or the sudan. (10marks)
Possible answers
Total sum = 12.5+ 100+ 35.5 +10.9 + 32.7+21.9 + 9.5 = 223
Average = 23/7= 32
Divergence = given value – mean value
For example divergence for USA = 12.5- 32 = -19.5
Table showing divergence
| Country | Irrigated land percentage of cropland | divergence |
| USA
Egypt China Sudan India Libya Republic of South Africa |
12.5
100 35.5 10.9 32.7 21.9 9.5 |
-19.5
68 3.5 -21 0.7 -10 -22 |
(b)Disadvantages of the statistical method above include
- Tedious
- Involve lengthy calculations
- Take a big space
- It is restricted to one purpose
- It does not portray actual values
(c) Candidates must select one country and explain the conditions that have favored irrigation farming
Irrigation farming in USA
The irrigation projects in USA;
- the central valley of California
- Snake river project on the Snake river plains, Phoenix project in Gila river, Columbia basin along Columbia river, Tennessee river project etc.
Factors that have favored irrigation farming in USA
Physical factors
- The arid/ Mediterranean and desert climate in California is characterized by low and unreliable rainfall rarely exceeding 400mm and hot temperatures above 300 during summer making agriculture difficult and necessitating irrigation.
- The gently slopping/low land of the central valley, death valley and Yucca valley in the south make irrigation cheap and easy because water freely flows under gravity.
- Availability of permanent water sources for irrigation by R. Sacramento, R. San Joaquin, and delta Mendota canal encourages use of irrigation throughout the year.
- The snowcapped Sierra Nevada Mountains provide a constant supply of melt water to rivers Sacramento, San Joaquin which is stored in Shasta dam and Friant dam and used for irrigation throughout the year.
- Availability of fertile alluvial soils deposited by R. Sacramento, san Joaquin favors growth of crops such as oranges and vegetables.
- Sparse population within California provide extensive land for carrying out irrigation farming.
- The gentle/relatively flat land scape in the ventral and Yucca valley favors mechanization and profitable output
- The Mediterranean/climate characterized by low rainfall and hot temperatures discourage the spread of pests and diseases which would destroy crops.
- The dry climate characterized by hot temperature of up to 300C during summer encourages growth and ripening fruits such as oranges, lemon, tomatoes etc.
- Presence of improved/modern/advanced technology for construction of canals and dams that store water for irrigation throughout the year.
- Ready market from the citizens and European countries.
- Availability of capital for construction of canals and dams.
- Presence of Agro processing industries that provide market for the produce.
- Presence of skilled and unskilled labor t work on the irrigational farms
- Political stability that encourages investment in irrigation schemes.
- Supportive government policies to irrigation cooperative , fruit processing industries etc.
- Presence of well developed transport and communication facilities.
- There was a great desire for California to increase food production for ever expanding population.
Irrigation in Sudan
Sudan is generally a dry country and has taken advantage of r. Nile to develop irrigation farming.
The major irrigation schemes in Sudan are
- Gezira Scheme on Gezira Plain along R. Nile; it produces cotton, maize, beans, etc.
- Rahad scheme located on River Rahad; produces cotton, ground nuts, vegetables and maize.
- Kanana Scheme located south of the major Gezira scheme for producing sugar canes
- Danszin irrigate ranch producing vegetables, fruits, beans, groundnuts etc.
- Gash Delta Scheme on R. Gash
- Kashm el Girba Scheme along R. Atbar in North-Eastern Sudan.
Factors that favors irrigation farming in Sudan
Physical factors
- The arid climate around the Gezira Scheme is characterized by high temperatures that promote the ripening of fruits.
- The Gezira plains are generally flat favoring mechanization as well as water flow in the irrigation canals enabling large scale farming.
- Pressence of fertile alluvial soils in the Gezira plains deposited by both White and Blue Nile promote growth of a variety of crops
- Availabiity of cheap large tracts of land along Gezira that favor largescale farming.
- Being dry; it lacks vegetation making it easy clear for irrigation farming.
- The gezira plains have a good water table such that water logging does not occur which favors growth of cotton and sugar cane
- Presence of a small population leading availability of land for irrigation farming
Other factors
- The rich history of irrigation in Sudan through use of shadoofs equipped the Sudanese with adequate irrigation skills.
- Presence of abundant skilled cheap labour to clear land for farming
- Availability of capital to set up irrigation scheme with support from UK
- Relative political stability to enable continuity of irrigation and security to protect the irrigation investments.
- The need to create employment opportunities to the people in the Gezira plains and Kordofan region lead to establishment and the success of the Gezira Scheme
- Appropriate research led to the success of the irrigation schemes.
- Study the table below showing Power and energy source for the selected countries and answer the questions that follow
| Country | Energy
Production (Billion kWh) |
Hydro-electric power
(%) |
Coal
(%) |
Oil
(%) |
Natural gas
(%) |
Nuclear Power (%) |
| China
Switzerland Egypt USA |
1,350
66 75 4,000 |
16.0
56.0 18.7 6.0 |
78.0
0.0 0.0 54.0 |
4.0
1.0 16.1 3.0 |
1.0
2.0 65.2 17.0 |
1.0
41.0 0.0 20.0 |
Adapted: 2003 world Development Indicator; World Bank, Washington, DC pp 151-154.
(a) Draw a compound divided rectangles to represent the information given in the table (10marks)
(b) Outline the advantages and disadvantages of using the statistical method in (a) above. (05marks)
(c) Account for the high energy production in either china or the USA (06marks)
(d) Explain the role of power and energy in the development of any one country given in the table
Solution
(a) A candidate is expected to find the percentages of the total energy consumed by each of the country which are plotted on the horizontal axis,
Total energy = 1,350 + 66 + 75 + 4000 = 5,491 Billion kWh
Percentage of energy consumed by each country

Cumulative percentage of energy is plotted on the vertical axis
Table of percentages
| Country | HEP
(%) |
Coal(%) | Oil(%) | Natural gas(%) | Nuclear Power (%) |
| China
Cummulative% Switzerland Cummulative% Egypt Cummulative% USA Cummulative% |
16.0
16.0 56.0 56 18.7 18.7 6.0 6.0 |
78.0
94 0.0 56 0.0 18.7 54.0 60.0 |
4.0
98 1.0 57 16.1 34.8 3.0 63.0 |
1.0
99 2.0 59 65.2 100 17.0 80.0 |
1.0
100 41.0 100 0.0 100 20.0 100 |

(b) Advantages of a compound divided rectangle
- Gives a good visual impression
- Easy to read and understand
- Good for comparison purposes
- Can represent many variables/versatile
- Shows two dependent variable
- Does not involve complicated calculations
Disadvantages of a compound divided rectangle
- It occupies a lot of space
- Difficult to read individual component parts since they are cumulative
- Choosing a suitable scale is difficult in case of great variations in values
- Time consuming
- It becomes congested with many variable
(c) A candidate should select one country and give the reasons. These are similar
- Availability/ abundance of power and enough energy sources.
- Market for power or energy in industries
- High level of technology
- Improved research
- Skilled and unskilled labour for power plant construction
- Favorable government policy
- Favorable political climate
- Efficient transport networks
- Availability of capital to buy power generating equipment
(d) Candidates should explain the outlined points giving specific examples
A candidate must name one country and explain the role of power and energy in the development. The reasons are more or less similar. They include
- Diversifies the economy
- Promotes trade cooperation
- Used in improving the transport sector
- Stimulates industrial development
- Leads to urbanization
- Stimulates agriculture production through stimulating agro industries
- Promotes tourism
- Provides employment
- Source of foreign exchange
- Source of government revenue
- Promote research and mineral exploitation
- Increases the index of development
NB. Candidates should explain the outlined points giving specific examples
- Study the map below showing the mean annual rainfall figures in millilitres for part of west Africa and answer the questions that follow

(a) Draw an isoline map showing rainfall distribution for West Africa
(b) Outline the merits of using the statistical method in (a) above
(c) Account for the rainfall distribution shown in the sketch map drawn in (a) above
(d) Explain the influence of rainfall distribution on human activities in the area shown on the sketch map.
Suggested solutions
(a)

(b) Merits
- Good visual impression
- Easy to interpret
- Can be super imposed
- Easy to draw/construct
- Does not involve calculations
- Easy to compare
(c) the rainfall distribution is due to
- Ocean current (Guinea + canary)
- ITCZ/latitudinal location in the equatorial belt
- Continentality/distance from the sea
- Trade winds
- Vegetation
- Relief
- Water bodies
- Man’s activities e.g. pastoralism, deforestation
(d) Influence of rainfall to man’s activities
Heavy rainfall
- Leads to lumbering due togrowth of (equatorial) forests
- Growing ofperennial crops in south/plantation farming
- Rivers lead fishing, water transport/HEP generation
- Favors settlement
- Favors wildlife hence tourism
- Favors agriculture and hence industrialization and trade.
Lowrainfall
- Favors pastoralism/transhumance
- Encourages irrigation farming
- Favors mining
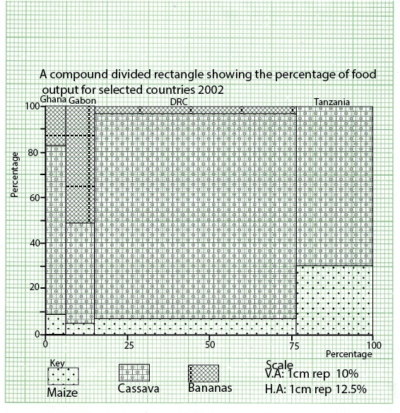
- Study the table below showing the percentage of food output for selected African countries (2002) ad answer the following questions that follow
| Country | Land Area
(‘000km2) |
Crops (% of total output) | ||
| Maize | Cassava | Bananas | ||
| Ghana | 228 | 8.4 | 75.4 | 16.2 |
| Gabon | 258 | 5.0 | 43.7 | 51.3 |
| DRC | 2,267 | 7.0 | 89.8 | 3.2 |
| Tanzania | 884 | 30.7 | 69.3 | 00 |
Adapted; 2003 African Development Indicators; World Bank, Washington, DC (pp. 5; 222-225)
(a) Draw a compound rectangle to portray the information In the table
(b) Outline the merits and demerits of using the method in (a) above
(c) (i) Identify the dominant crop grown in the countries given in the table.
(ii) account for the dominance of the crop identified in (c)(i) above
(d) Explain the contribution of the agricultural sector to the development of any one country given in the table.
Suggested answers
(a) A candidate is expected to find the percentages of the total land consumed by each of the country which are plotted on the horizontal axis,
Total Land = 228+ 258 + 2,267 + 884 = 3637
Percentag of land occupied by each country
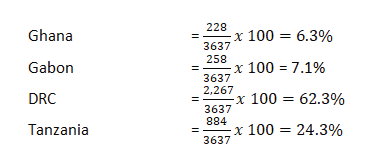
Table of cumulative frequency of percentages of land
| Countries | Ghana | Gabon | DRC | Tanzania |
| Cumulative Frequency | 6.3 | 13.4 | 75.7 | 100 |
Cumulative percentage of crops is plotted on the vertical axis
Table of cumulative percentages of crops
| Country | Crops (% of total output) | ||
| Maize | Cassava | Bananas | |
| Ghana | 8.4 | 75.4 | 16.2 |
| Cumulative % | 8.4 | 83.8 | 100 |
| Gabon | 5.0 | 43.7 | 51.3 |
| Cumulative % | 5.0 | 48.7 | 100 |
| DRC | 7.0 | 89.8 | 3.2 |
| Cumulative % | 7.0 | 96.8 | 100 |
| Tanzania | 30.7 | 69.3 | 00 |
| Cumulative % | 30.7 | 100 | 100 |
(b) Merits include
- Easy to draw/construct
- Easy to interpret
- Easy for comparison
- Can represent many items/variables
- Gives clear visual impression
- Does not involve difficult calculations
- Can be super imposed on other diagrams
Demerits include
- Many items/variables make the diagram congested/difficult to interpret
- In case of large amplitude, finding a suitable scale is difficult
- It does not show actual values
- Time consuming
- Occupies large space
(c) (i) Cassava
(ii)
- Easy to grow
- Can tolerate greater variations in climate
- Can grow on variety of soils
- It is resistant to pests and diseases
- It is the main staple food in Africa
- It does not need a lot of care
- It easily stored in dry form
- Candidate should select one country and explain its contribution of agriciltural sector to its development, the points are the same
For Ghana
- Source of food for the people
- Source of foreign exchange
- Provides employment to the people
- Provide raw materials to agro industries
- Encourages development of transport network
- Promote trade and cooperation
- Provide education/research grounds
- Diversifies the economy
- Attracts foreign investors.
- Study the table belowshowing annual average fish Export and Imports in thousands of US $ for selected countries (1998- 2000) and answer the questions that follow
| Country | Exports
(‘000s US $) |
Imports
(‘000s US $) |
| Angola
Ghana Peru Republic of south Africa Sweden |
10,800
81,100 852,200 259,000 472,000 |
14,300
97,300 15,400 64,100 688,900 |
| Total | 1,675,100 | 880,000 |
Adapted: world Resources (2002 – 2004): Decissions for the Earth; Balance, Voice and Power: UNDP. UNEP, World Bank & World Resources Institute pp 266- 7
(a) Draw a combined proportional divided semi-circle pie-chart to potray the information in the table
(b) What are the merits of using the statistical method in (a) above?
(c) Identify the with the
(i) Highest fish export value
(ii) Lowest fish import value
(d) Account for the development of the fishing industry in the country identified in (c)(i) above.
Suggested solution
Calculation


(b) Merits
- Gives a good visual impression
- Easy to read and understand
- Good for comparison purposes
- Can represent many variables/veratile
- Easyto draw/construct
- Easy to interpret
(c)(i) Sweden
(ii) Angola
(d)
- Availability/ abundance fish varieties
- Large forest reserves that provide timber for making boats
- Market for fish from european countries
- Presence of Baltic seaprovides sheltered water for fish breeding and multiplication
- High level of technology
- Improved research
- Skilled and unskilled labour for fish industry
- Favorable government policy
- Favorable political climate
- Efficient transport networks
- Availability of capital to invest in fish industry
- Fish provide nutritious food
Thank you
Dr. Bbosa Science
Sir may l have online classes with you people please
watch the videoin paper, on You tube search type the topic folloed by Dr. Bbosa Science
Wow amazing
Good work
It’s good work Dr.
very good
thank u
It is very important website, Iam really interested
Good work done comrade
More brighter 4 even a slow learner catch the concept.
I appreciate you continue
Good
Thank you sir
The work was so helpful but please could you include proportional squares and circles please
Thank you
Thanks l request for paper one
Flow map
Though Ts late
You make me see things in a new light. Home & Kitchen