Graphs and plotting – primary mathematic

Graphs
The common graphs at primary level are the line graphs and bar graphs.
Line graph
A line graph is a type of chart used to show information that changes over time.
We plot line graphs using several points connected by straight lines.
The line graph comprises of two axes known as ‘x’ axis and ‘y’ axis.
- The horizontal axis is known as the x-axis.
- The vertical axis is known as the y-axis.
Plotting a line graph
Plotting a line graph is easy. Here are the simple steps to consider while plotting a line graph.
- Draw the x-axis and y-axis on the graph paper. Make sure to write the title above the table so that it determines the purpose of the graph.
- For instance, if one of the factors is time, it goes on the horizontal axis, referred to as the x-axis. The other factor would subsequently go on the vertical axis, which is known as the y-axis. Label both the axes as per their respective factors. For example, we can label the x-axis as time or day.
- Afterward, with the help of the already given data, point out the exact values on the graph. Once you join the points, you can make a clear inference about the trend.
Example 1
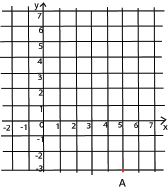
On the grid below mark a point A whose coordinates are (5, -3).
Solution
Mark point A – 5 point along the X-axis and -3 point along the y-axis

Example 2
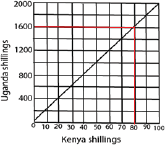
The graph below was used for converting Kenya shillings into Uganda shillings. Use it to answer parts (a) and (b)

(a) If you had 1 Kenya shilling, how many Uganda shillings would you have got?

(b) How many Kenya shillings would one have got for Uganda shillings 1 400?

Bar graphs
The length of each bar is proportional to the amount that it represents.
Example 3
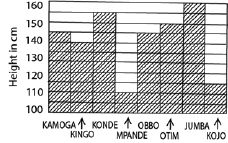
The bar graph below shows heights in cm of 8 boys from Kelima Primary School. Use it to answer the questions that follow;

(a) Complete the table below
| Kamoga | Kingo | Konde | Mpambe | Obbo | Otim | Jumba | Kojo |
| 145cm | 140cm | 155cm | 110cm | 145cm | 160cm | 160cm | 115cm |
(b) What is the height of the shortest boy?
The height of the shortest boy = 110cm
(c) What does one square on the vertical axis represent?
1 square on vertical axis = 5cm
For more examples and exercise download PDF below
Graphs and plotting- upper primary
Sponsored by the Science Foundation College + 256 753 80 27 09
Compiled by Dr. Bbosa Science + 256 778 633 682
Please like our page before you leave

You really know your stuff. 500 ka redeem code
Get expert assistance for MBBS Admission Through Management/Nri Quota in Karnataka.
Explore cost transparency for your medical education at MBBS Fees Structure in Haryana.
Dive into the world of Goa Games and test your strategy skills in a vibrant, immersive environment.
Start your journey to Make Money Online today with TS EARN’s step-by-step guides.
Boost your gaming experience with the latest Raja Luck Invite Code available now.
New users can get extra perks by applying the Raja Luck Invite Code at sign-up.
Master the procedure of How to get backlinks and improve your SEO method effectively.
Take pleasure in special member advantages and loyalty rewards by registering with the Diu Win Invite Code.
Register now and take pleasure in VIP benefits with the Goa Games Invite Code.
Use a protected and easy to use gaming platform with bdg-win.
Enjoy competitive competitions and special promos at 55-club.
Get insights into What Is a Technology Roadmap and how it supports IT and business alignment.
Get detailed chest scans for accurate medical evaluations with Thoracic CT. **.
Credibility matters when it concerns a Chennai Escorts Service.
The Yamuna Expressway Authority Property Dealers here supply excellent service and deals.